Thahbib Rahman
Research Analyst
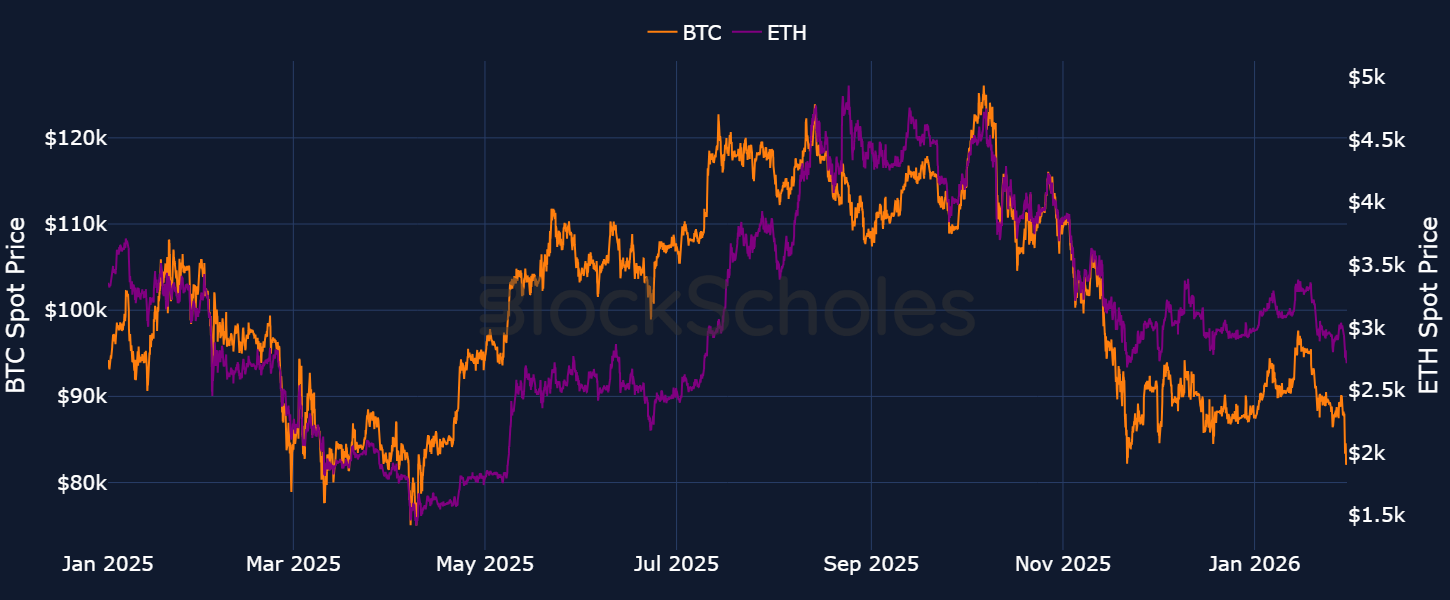
Markets are aggressively repricing the Fed’s policy outlook, with the US dollar rebounding in anticipation of a less-dovish Fed under Kevin Warsh - President Trump’s confirmed pick for Fed Chair. A sharp reversal in precious metals has seen crypto take another leg lower, with the broader market losing around 4.7% of total crypto market cap in 24 hours. The move leaves BTC and ETH down over 5% and 8% year-to-date respectively – BTC around $82K puts it more than 30% below the Oct 6, 2025 high of $126.1K.

Key insights
Markets are aggressively repricing the Fed’s policy outlook, with the US dollar rebounding in anticipation of a less-dovish Fed under Kevin Warsh - President Trump’s confirmed pick for Fed Chair.
A sharp reversal in precious metals has seen crypto take another leg lower, with the broader market losing around 4.7% of total crypto market cap in 24 hours. The move leaves BTC and ETH down over 5% and 8% year-to-date respectively – BTC around $82K puts it more than 30% below the Oct 6, 2025 high of $126.1K.
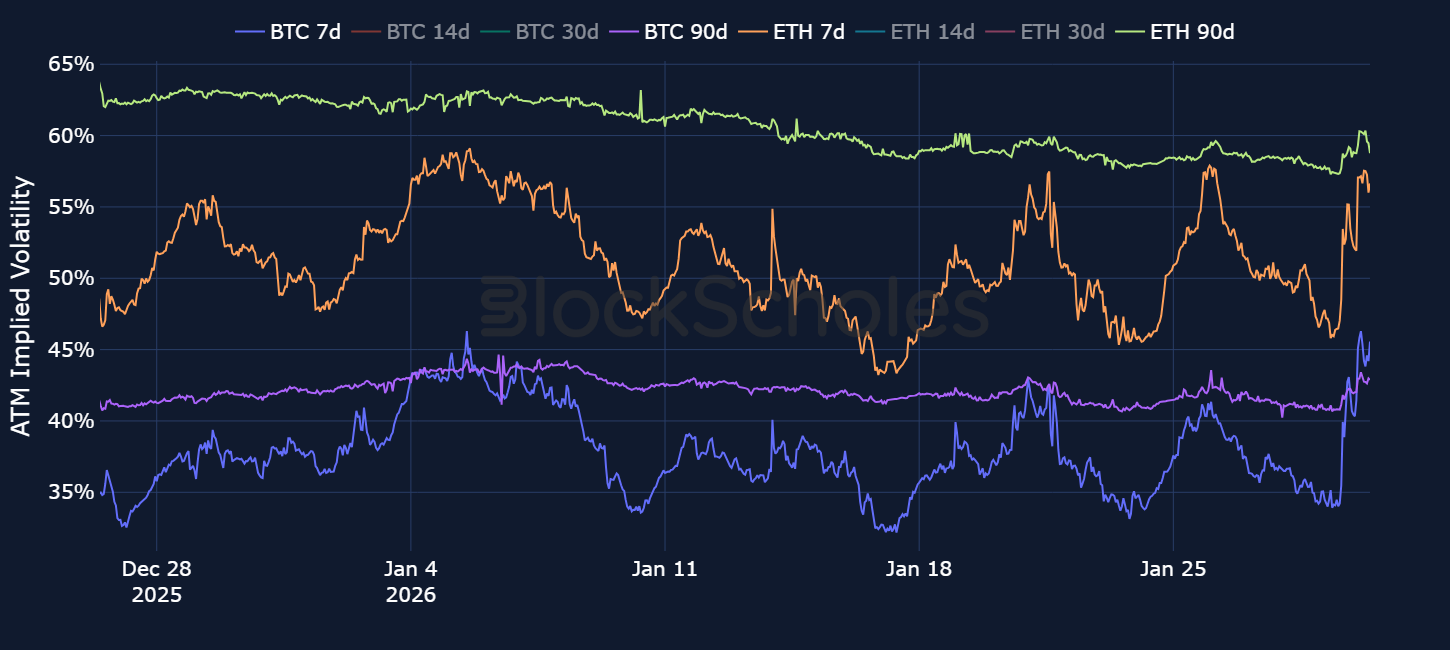
After weeks of slumber, the latest selloff has finally translated into a jump in short-tenor options implied volatility: the one-week at-the-money implied volatility level rose to ~46% for BTC and ~58% for ETH.
However, the response has been strangely limited to short-dated options only: longer-dated volatility levels have not spiked as aggressively as we would typically expect after a drawdown of this magnitude.
We see the same behaviour in other measures of derivatives markets participation – while low compared to pre-Oct 10 liquidation event highs, the open interest of perpetual swap contracts has not capitulated alongside spot.
Over the past 24 hours, Wall Street and crypto markets alike are seeing a steep selloff that’s seen BTC fall to a two-month low of $81K, more than 30% below the Oct 6, 2025 all-time high of $126.1K. The move saw 4.7% of the total crypto market capitalization lost, with Ether falling close to 8% and far below the $3,000 psychological level at $2.7K.
That sharp decline has been enough to inspire sharp movements in at-the-money implied volatility — particularly at shorter tenors. BTC’s one-week at-the-money implied volatility level has spiked 12 percentage points to trade at 46%, while ETH volatility jumped 11 vol points to 58%.
However, volatility at longer tenors has not spiked as strongly as we might expect. That suggests that traders, at least for now, have priced in higher expectations for volatility in the near-term only.
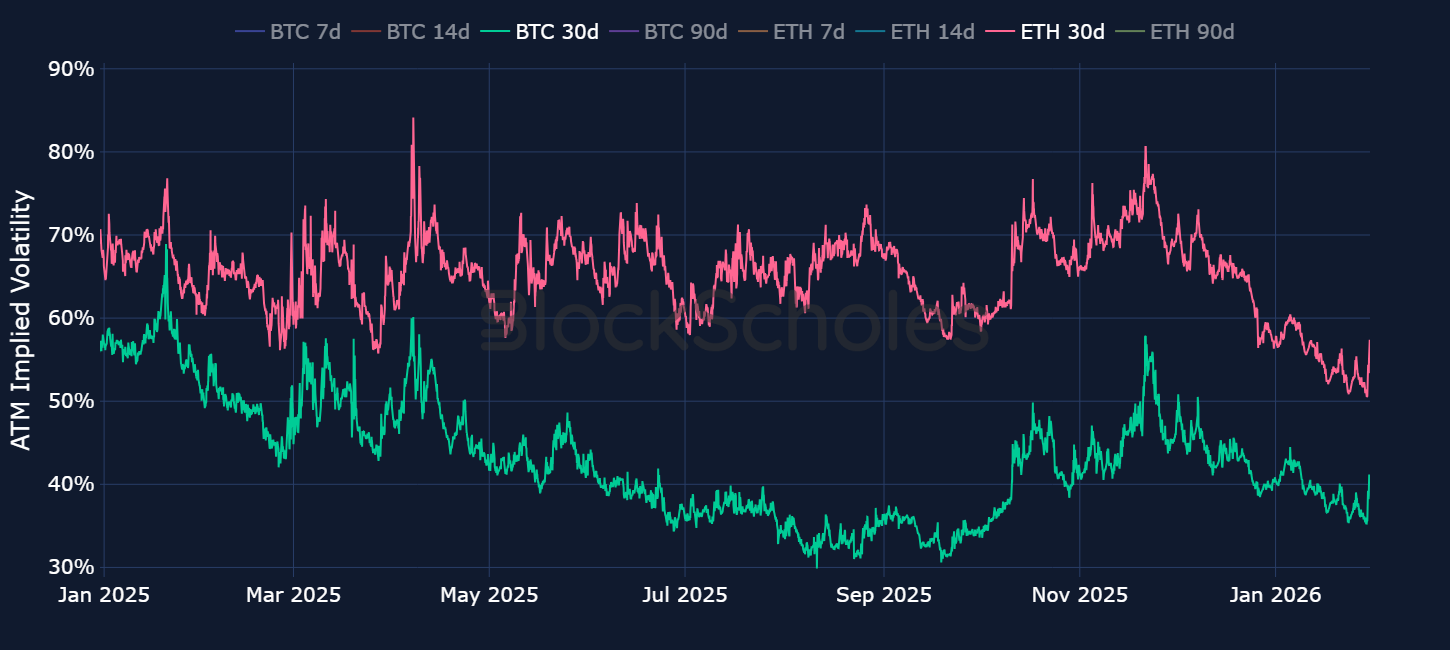
At longer tenors, BTC and ETH implied volatility levels remain meaningfully lower than the levels at the turn of the year. Since the upward spikes in October and November, BTC and ETH at-the-money implied volatility has slowly trended lower, with ETH volatility falling at an even faster rate than BTC.
Even the Fed’s first meeting of the year, which saw the FOMC vote 10-2 in favour of leaving the benchmark federal funds rate, did very little to impact volatility expectations. We can see that by comparing the term structure of volatility before and after Chair Powell’s press conference for both majors.
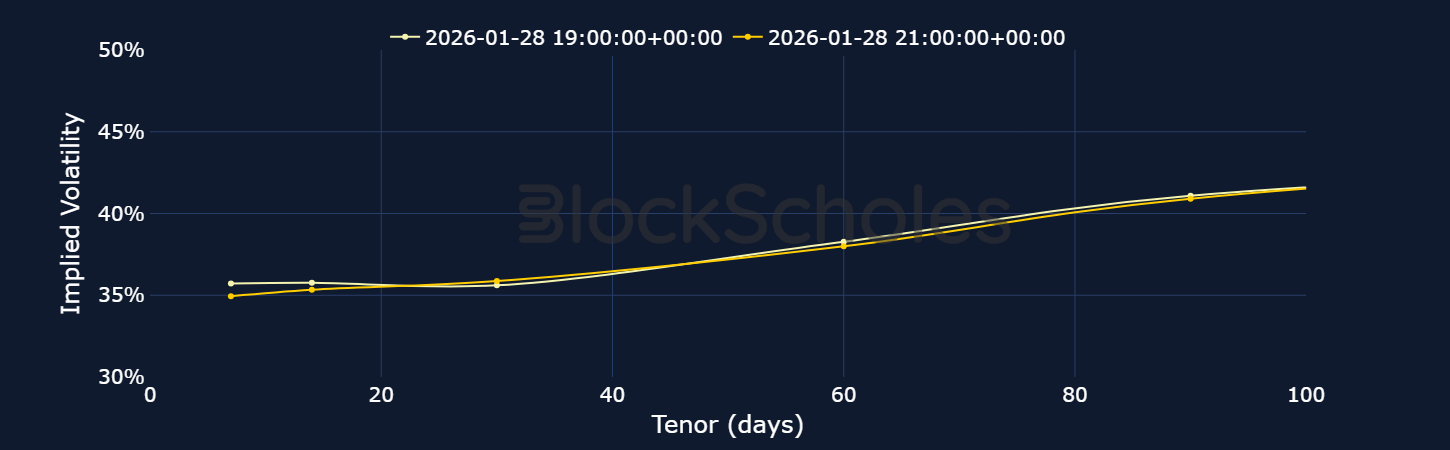
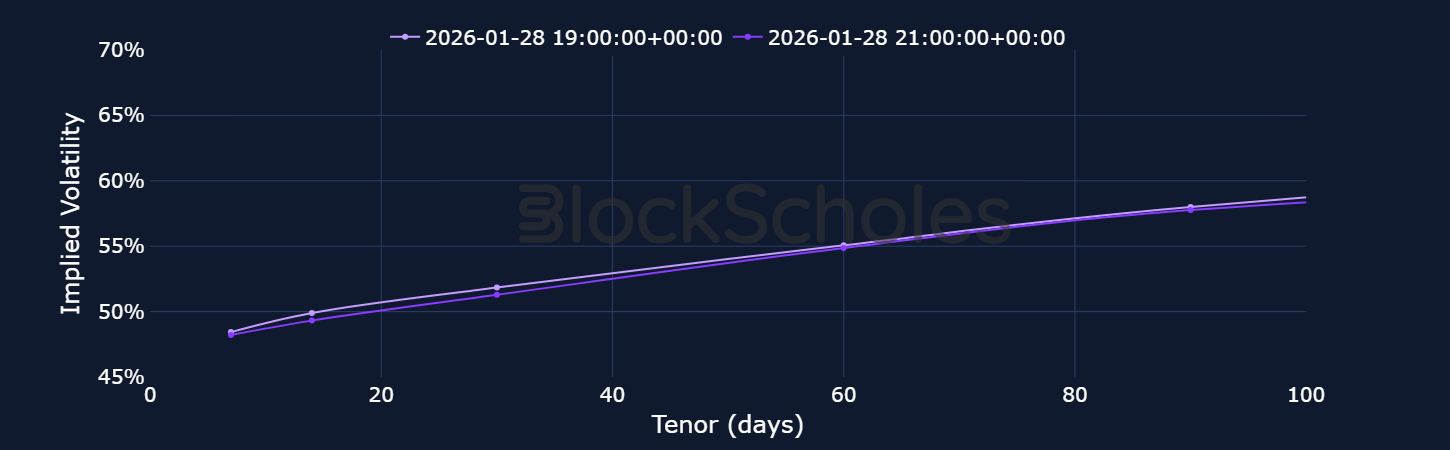
Overall, both the FOMC policy statement and Chair Powell’s press conference leaned slightly hawkish, with an emphasis that the Fed is “well-positioned” to wait-and-see how the economy evolves. In the subsequent press conference, the Chair steered clear of indicating when markets could expect the first rate cut of the year, and was even more evasive when it came to political-related questions.
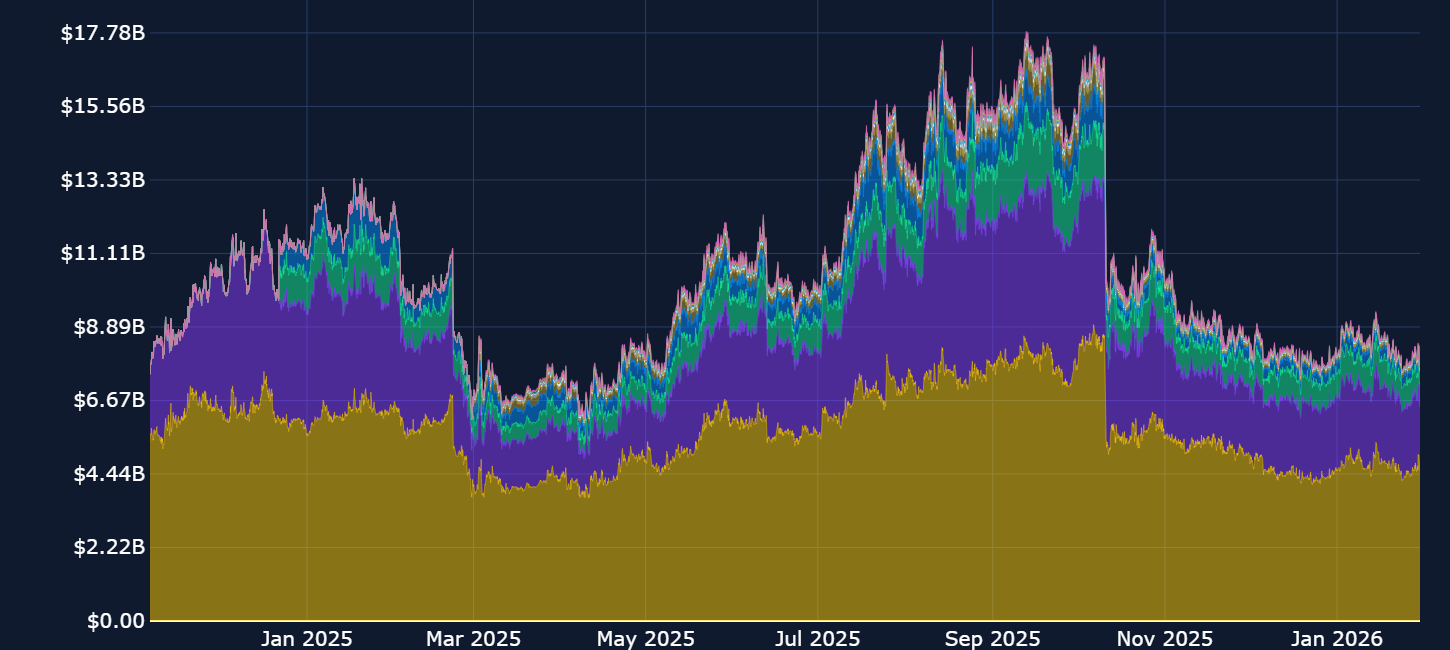
Potentially contributing to the wider trend of lower volatility is the current lack of participation from traders across markets. Open interest in perpetual futures contracts (a good measure of willingness of trader participation and leverage in the market) is well below the peak levels reached prior to and around the time of the October 10 liquidation event. Not only is open interest well below those peaks, daily trade volumes are equally far lower than levels seen in the first three quarters of 2025.
Daily trade volumes in perpetuals are equally far lower than levels seen in the first three quarters of 2025 (chart below).
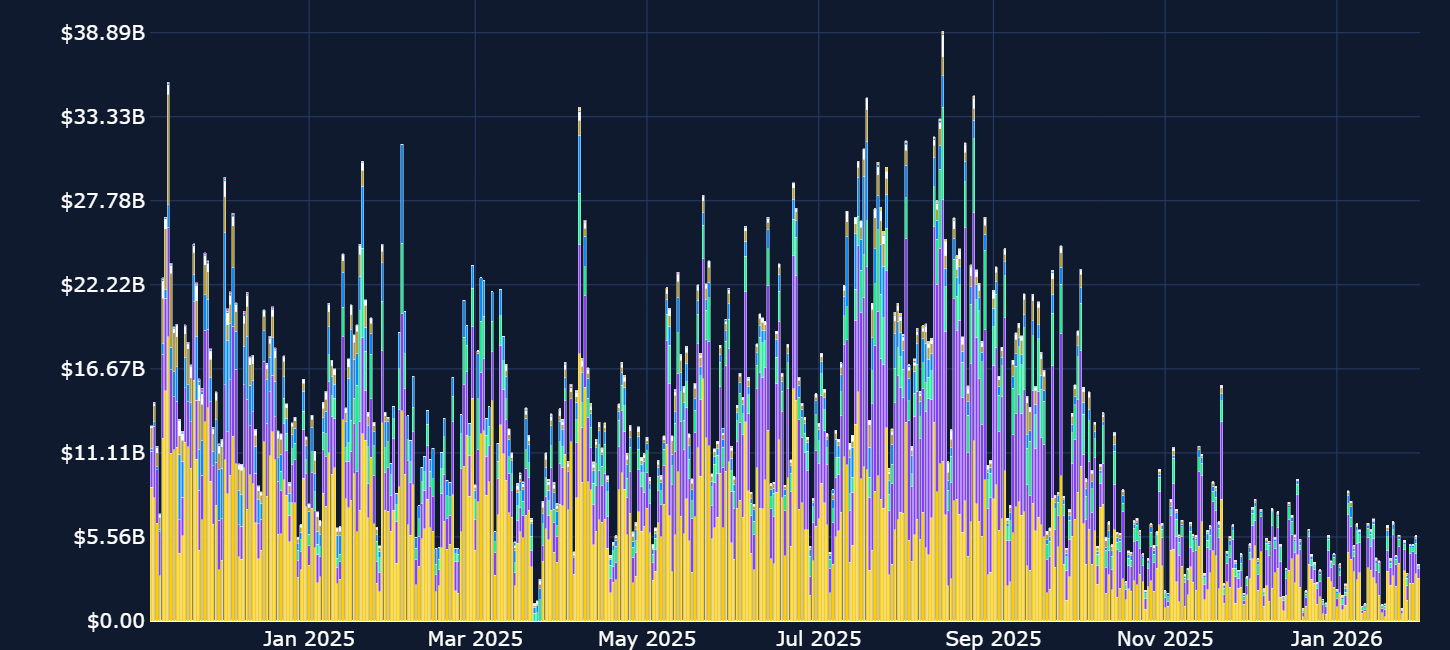
The relationship between trade volumes and volatility applies in both directions. Large price moves in the underlying (i.e., high realized volatility) often coincide with periods of higher trading volume as new participants enter the market. Equally, higher trading volumes can also push up volatility.
Nonetheless, realized volatility, implied volatility and daily trading volumes have each tailed off since the spikes of October and November 2025, indicating a lack of retail participation.

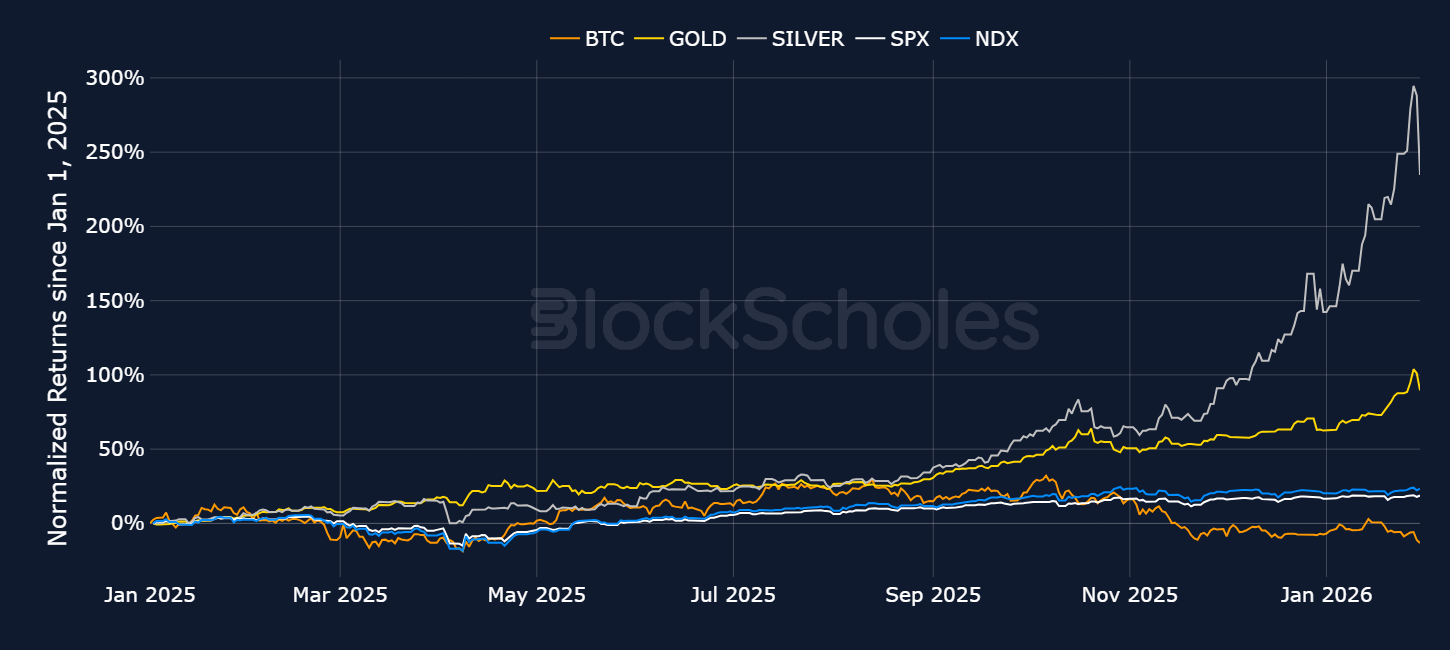
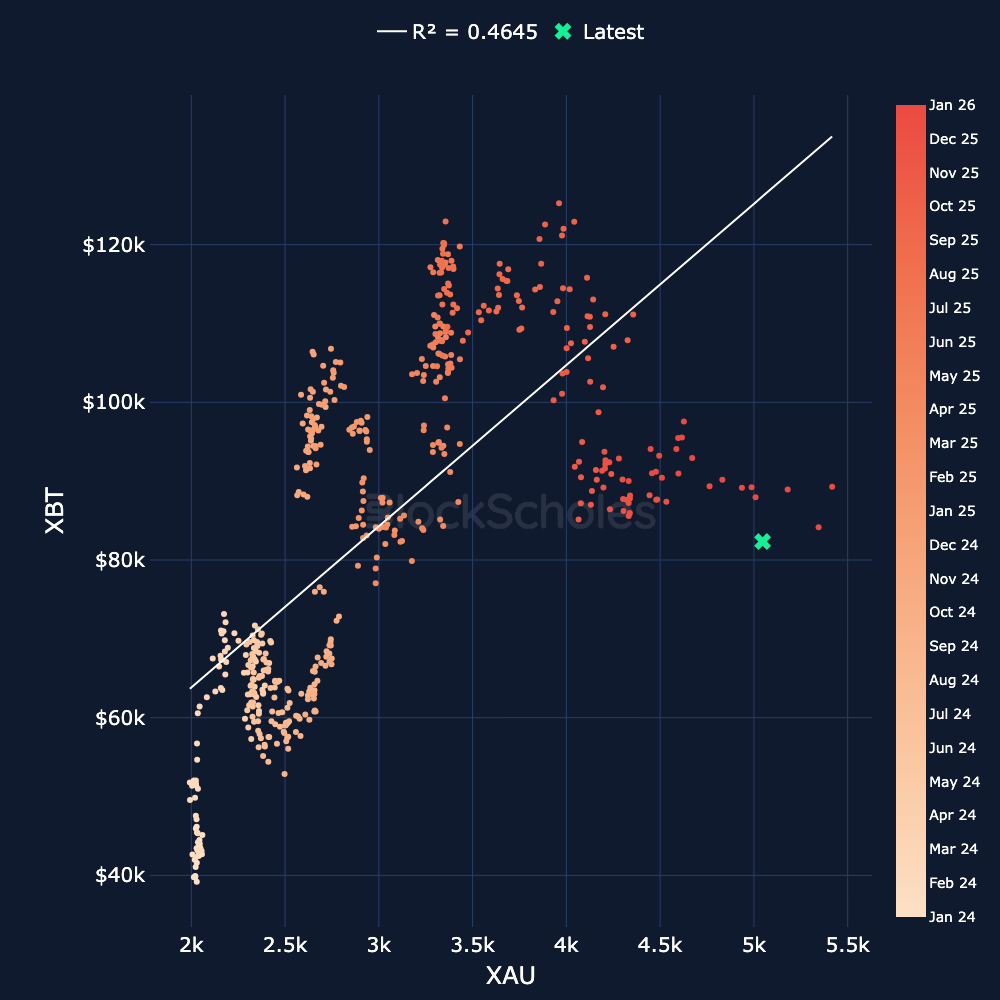
The rally in precious metals was one of the biggest narratives of 2025, as gold and silver both had their best year since 1979. While both reached new all time highs one month into 2026, they have ended the month on a reversal of much of these gains to still trade close to 20% and 40% up year-to-date, respectively. In contrast, BTC which ended 2025 down more than 6% and has returned around -5% YTD. Gold’s strong performance has seen it outperform BTC since 2021.
One way to visualise BTC’s relative underperformance relative to gold is through the scatter plot below of the two asset’s spot prices.
According to its linear relationship, a gold price of $5,000 would imply a BTC price upwards of $120K (significantly higher than the $82K we see it currently trading at). However, we have already seen a second-order effect on crypto prices as a result of the current precious metals rally — one that could gain even further traction in the coming few months.
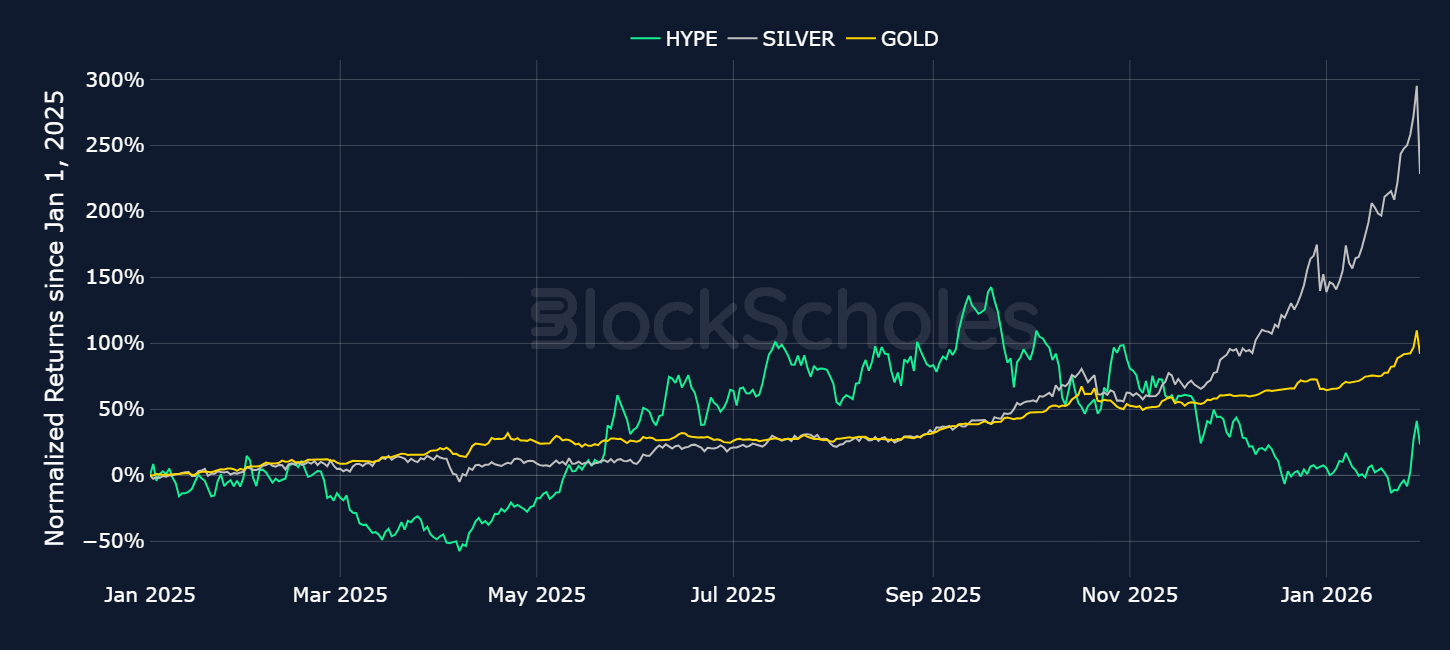
Take the example of Hyperliquid’s native token HYPE, which has surged 42% over the past seven days. A large driver of that spot price rally has been on the back of an explosion in the volume of real-world asset related perpetual contracts (particularly silver and gold perp contracts), which themselves have grown in popularity given the rally in precious metals.
Hyperliquid’s buyback program attributes 97% of protocol revenue to token buybacks which makes the domino effect very clear: higher volumes traded on the back of silver and gold perps (and other RWA-perps) result in more token buybacks, which lower token supply, and help bolster price. We can see from the chart below that HYPE has positioned itself as a second-order beneficiary of the current rally in precious metals.
We also see the possibility for a more direct form of capital rotation to take place from traditional precious metals into digital assets. Historically, BTC has proven to be more correlated to US tech stocks than to silver and gold.
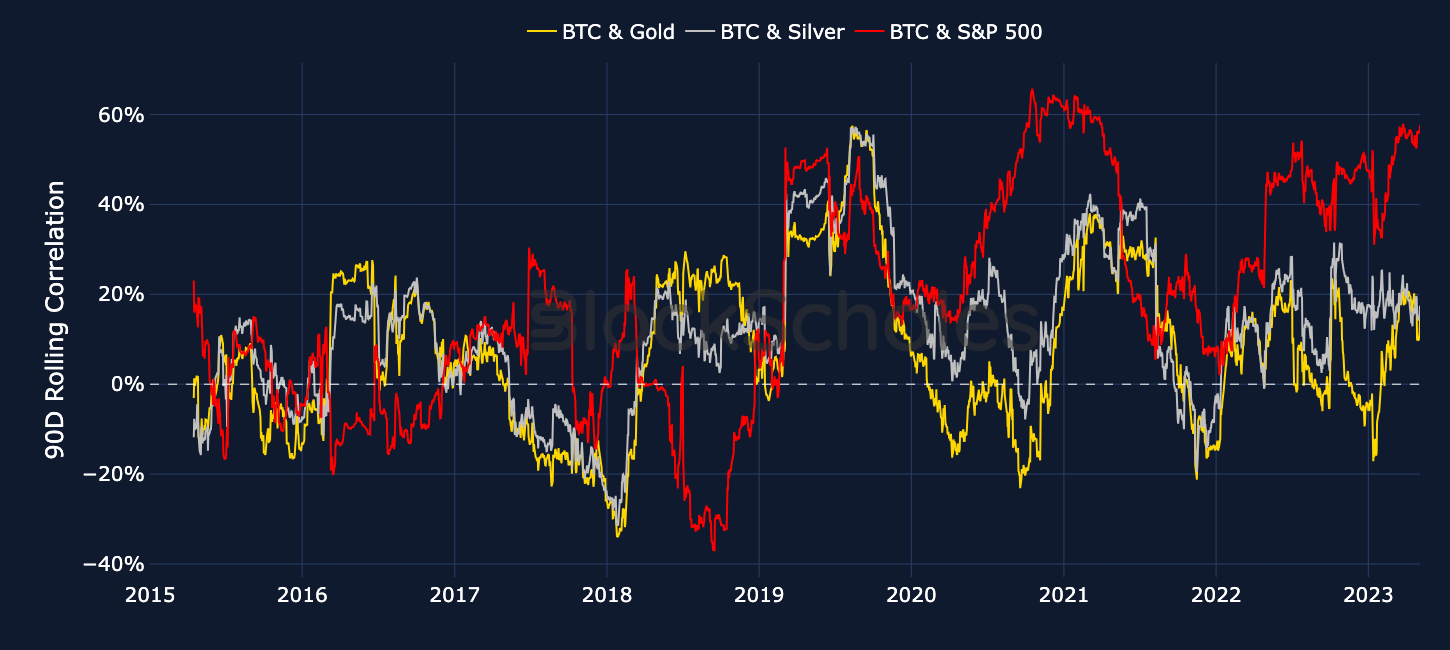
However, if at least some of the rally in the latter has been driven by speculative flows and retail interest, it could be likely that traders will end up taking profits on precious metals and look for other asset classes to park their capital in. Given that US equities were recently already at record highs, and BTC’s underperformance both relative to safe haven-metals and US risk-on equities, that positions it and other crypto altcoins, further up the risk curve, as likely beneficiaries of a rotation.
Capybobo (PYBOBO) is positioning itself as a Web3 “social IP” ecosystem that fuses lightweight gaming with collectable, capybara-themed art toys, operating on Solana and TON.
The project launched at an $8M valuation and claims a user base of more than 2M, leaning heavily into distribution via familiar messaging platforms like Telegram and LINE through casual mini-games that are designed for fast, repeatable play.
At the centre of the ecosystem is the PYBOBO token, with a fixed supply of 100B, used as the utility layer for day-to-day activity - buying skins, upgrading avatars, unlocking features, and redeeming digital collectables for physical items.
Bybit added PYBOBO to Spot with a PYBOBO/USDT pair, with deposits opened on 26 January 2026.

.jpg)


.jpg)


.jpeg)


.jpg)


.jpg)
