Thahbib Rahman
Research Analyst
“This time it’s different” — the four year cycle can no longer be used as the primary framework for spot price behavior in 2026. A new source of demand, supportive macro conditions and continued regulatory support encourages a constructive base case for 2026 — not the definitive bear market the traditional four-year cycle theory would suggest.

Sir John Templeton famously cautioned investors that the most dangerous phrase in markets is “This time it’s different.” New narratives may emerge, but the forces of cycles, sentiment and risk never disappear.
Yet, we’re confronted with the possibility that this time it might just be different. The four-year cycle has been used as a guidepost to what we can expect in the upcoming period and this view determines forward expectations. To believe the cycle is intact implies a sell-off into 2026, while a broken cycle allows for crypto to take a new path.
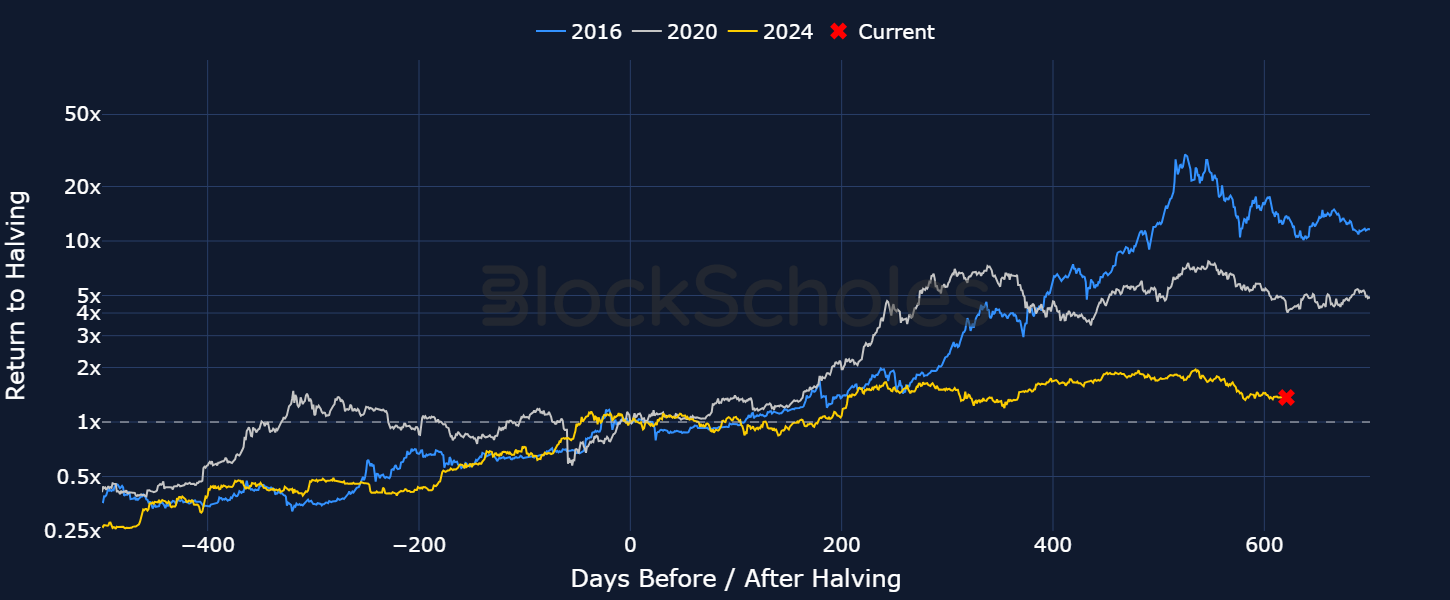
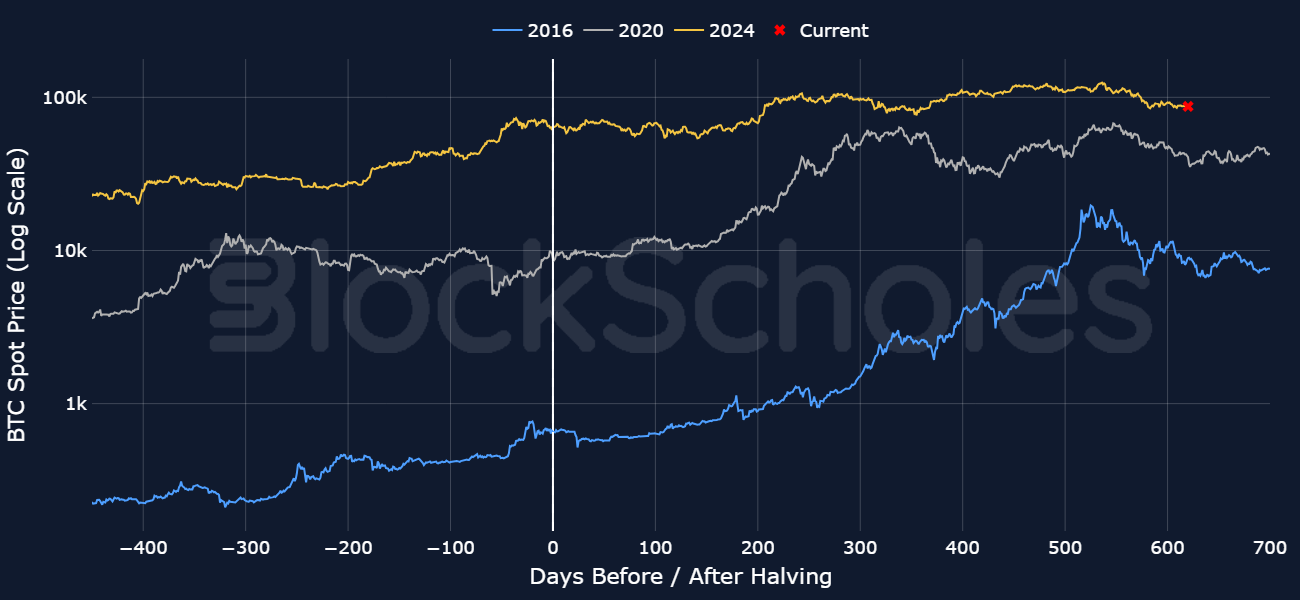
Traditionally, crypto’s four-year cycle has consisted of a period of sideways Bitcoin price action pre-halving, followed by a strong rally after the halving, new ATHs, and then a longer bear market. Bitcoin did rally following this cycle’s halving, reinforcing the historical “four-year cycle”. Total returns around 600 days after each halving — where we are now — have trended lower across cycles, from 2016 to 2020 and now into the 2024 cycle.
DECODE: Every 4 years (210,000 blocks) the bitcoin awarded to miners for mining a block is halved. Halving events have historically preceded large rallies in BTC spot price.
Bitcoin’s growing maturity and institutionalization have reshaped its return profile and caused it to break away from past cycle behavior.
From a purely spot-return perspective, Bitcoin’s 2024–2025 cycle has aligned with previous four-year cycles by reaching multiple new ATHs and delivering positive post-halving performance. If the four-year cycle no longer applies, will we see the late-2025 downturn deepen into a fully-fledged bear market?
The first major difference in the current cycle is the trajectory of Bitcoin dominance. In previous cycles, BTC’s market cap relative to the total crypto market cap has dropped sharply, signaling the onset of a classic “altcoin season.” In the 2024 cycle, Bitcoin dominance has not shown this distinct crash. As a result, sentiment and expectations for an altcoin season are fading, with little evidence of the dominance shift that has historically fueled broader altcoin rallies.
DECODE: Altcoins refer to cryptocurrencies excluding BTC (and sometimes excluding ETH), such as other Layer 1 blockchain tokens, utility tokens, or memecoins.
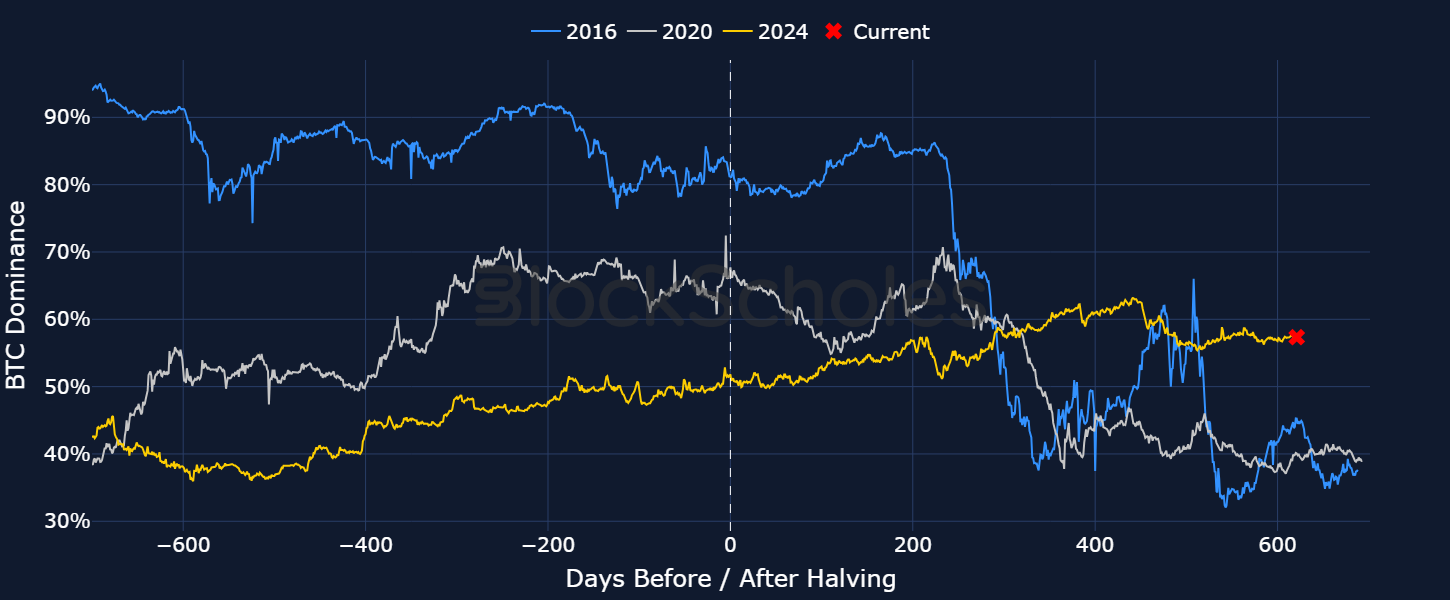
There have been two larger drawdowns in dominance, each teasing an altcoin season but ultimately not delivering.
However, these recent Bitcoin dominance drawdowns are not on the same scale as previous drawdowns.
As seen in the figures above, the 2016 cycle showed a drop of 40% in the proportion of crypto’s market capitalization commanded by Bitcoin, and the 2020 cycle saw a similarly large crash of 30% in its market cap proportion, both significantly changing the composition of the global crypto market capitalization. While this doesn’t mean that a fall in Bitcoin market capitalization dominance of that magnitude is not possible in this cycle, it does indicate that such a move, if it happens, would occur far later than expected.
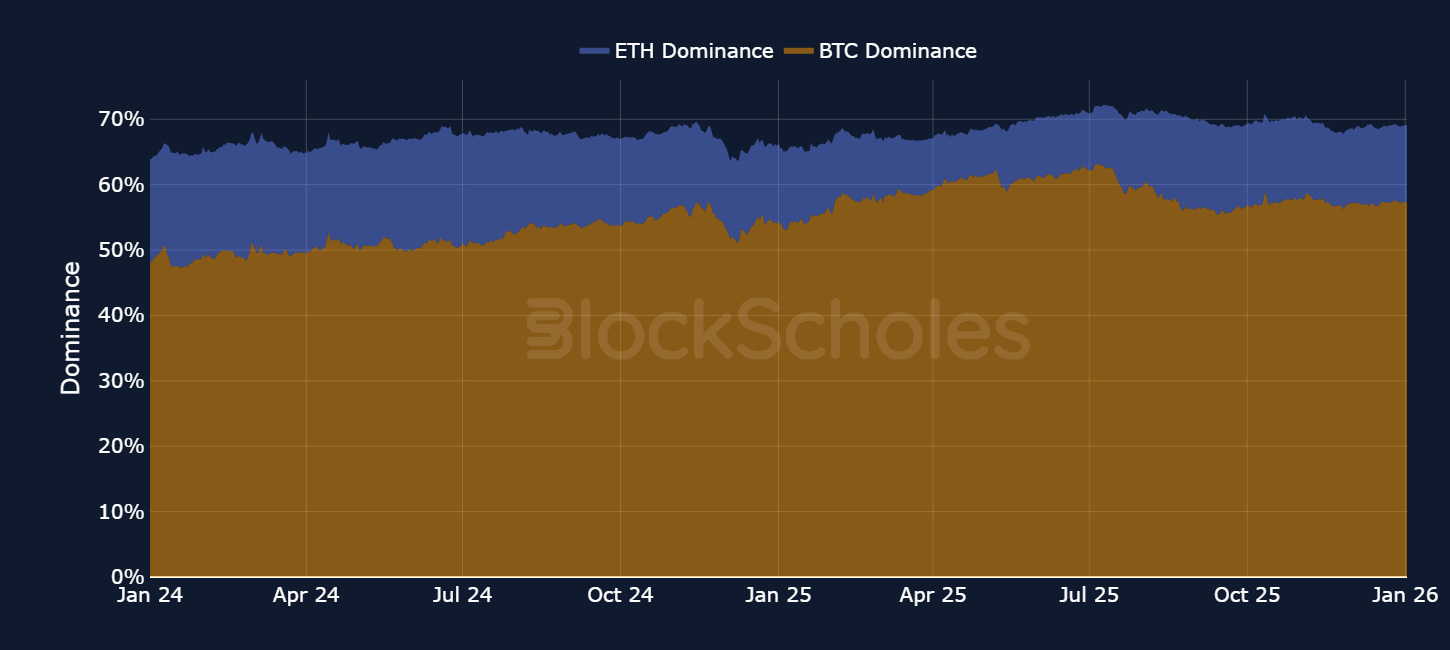
A combined view of BTC and ETH’s market share of the global crypto market cap shows a consistent sum of around 70%, which has in fact been steadily growing. With ETH dominance over the last period being mostly sideways, the increase in the combined BTC+ETH share has been driven almost entirely by BTC, not ETH. Any decline in BTC dominance has largely shifted toward ETH, leaving altcoins still marginalised.
Our first indication of a different cycle came before the halving. Despite a rally to a new all-time high traditionally occurring after the halving, 2024 delivered an ATH pre-halving in March 2024. This was driven by the Spot BTC ETF launch, which created a regulated space for institutions to invest in BTC — a foreshadowing of BTC’s strengthened correlation with institutional demand.
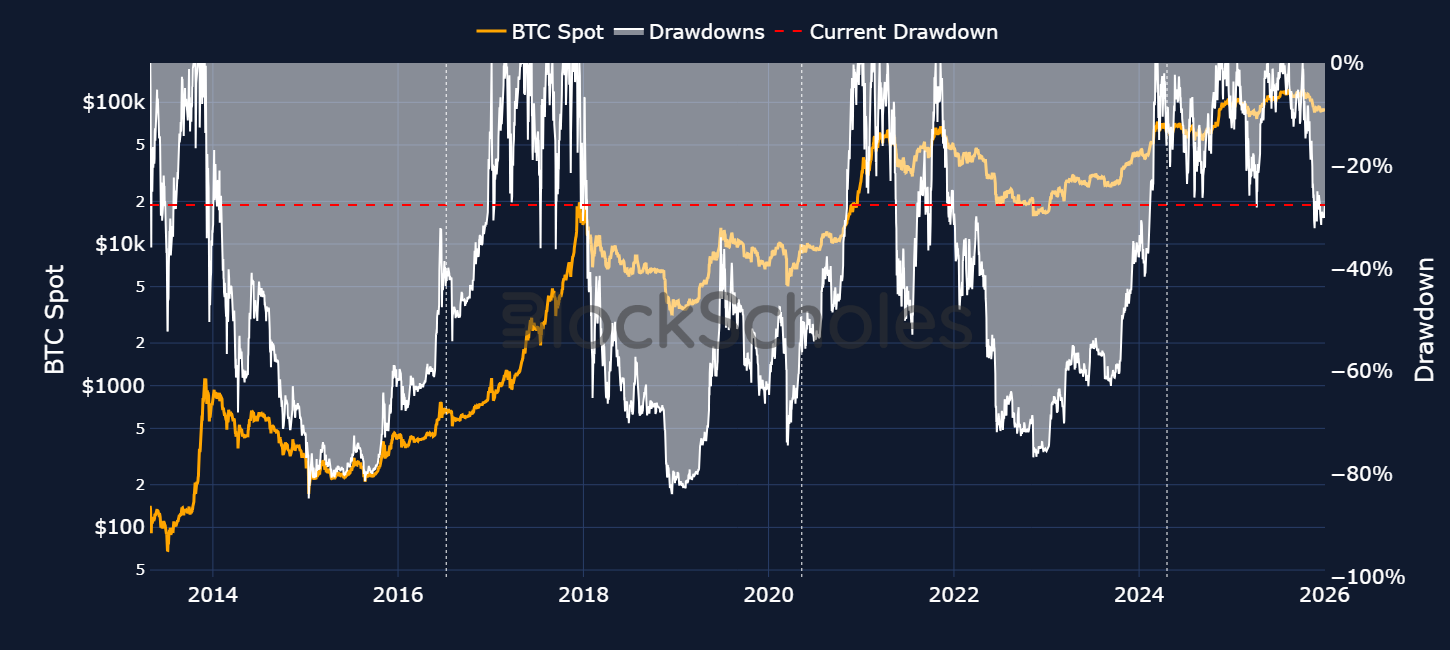
Since then, BTC dominance has remained high while BTC spot price has dropped 30% from its $126K October ATH, raising the question of whether this drop resembles previous cycle-ending drawdowns.
BTC has previously endured much deeper bear markets (e.g., the China ban, 2020 stresses, 2022 “crypto winter”), where drawdowns exceeded ~60%. However, historical context shows that the eventual cycle peaks of 2014, 2018, and 2022 each occurred after larger drawdowns than we’ve seen in this cycle.
We also do not see the magnitude or structure of sell-offs observed in prior cycle tops, weakening the argument that this is a final-cycle drawdown. Additionally, as the chart below shows, the current period is materially longer than prior cycles, further indicating a new market structure.
Conviction in the four-year cycle can be used to form a 2026 outlook:
We believe that this cycle has broken away from the traditional four-year pattern largely due to a structural change in demand. BTC and ETH spot ETFs have changed the main buyer from app-based retail traders on offshore exchanges to allocation-driven investors. Adding to this shift are Digital Asset Treasuries (DATs) that aggressively accumulate BTC and ETH, such as Strategy and Bitmine, which have added a second, persistent source of demand.
Together, a different investor base means that price action is now influenced by a different set of drivers – more by macro conditions and regulatory developments. These new demand sources have already changed the nature of the cycle that we have seen already, and will continue to impact the nature of price action in 2026.
In previous four-year cycles, most crypto capital came from retail users trading on exchanges. The pattern was familiar: people bought BTC, then rotated into ETH, and eventually into smaller altcoins and meme coins. That broad rotation down the risk spectrum produced the “everything else rallies” that usually then marked the end of the cycle.
DECODE: Exchange-traded funds (ETFs) offer a regulated vehicle for investors to gain crypto exposure through traditional brokerage and custody rails, without using wallets or private keys. They have expanded the crypto investor base to include institutions, advisers, and other onshore allocators that previously couldn’t (or wouldn’t) access spot crypto directly.
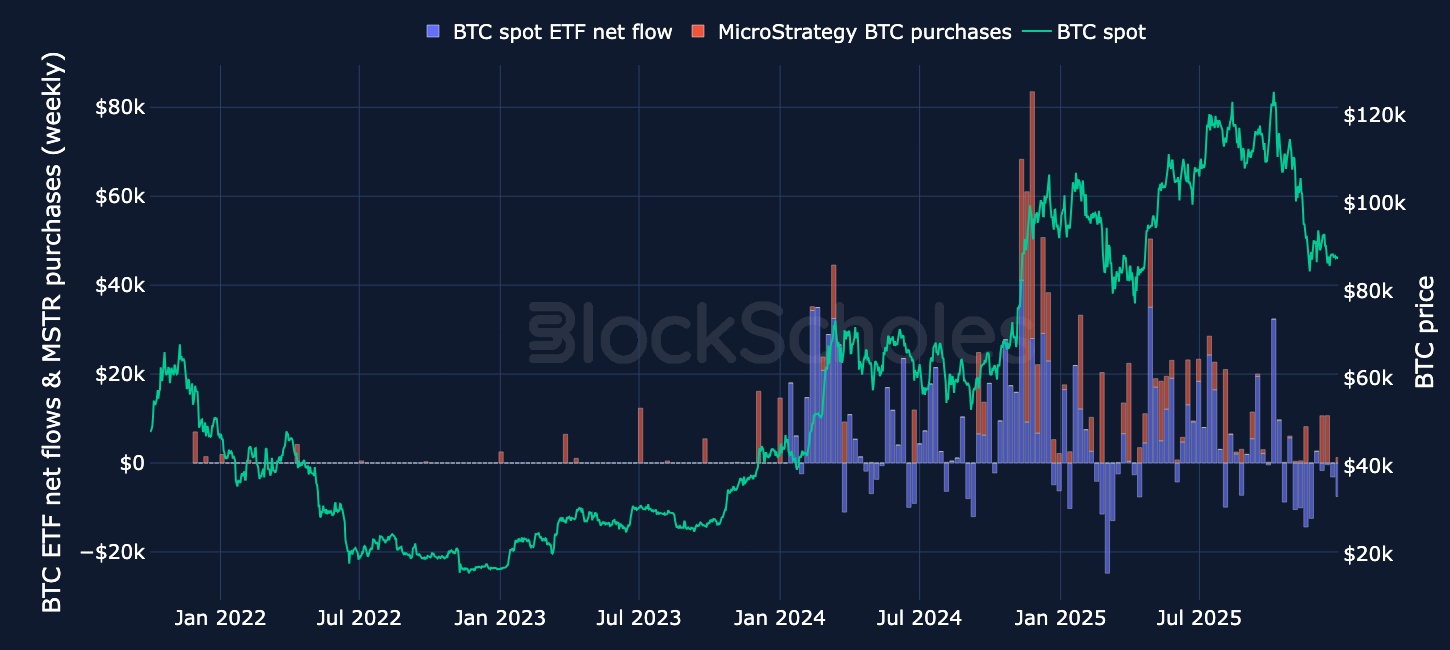
In the 2024-2025 bull-cycle, a much larger share of new capital has come via spot ETFs (allowing onshore, regulated access to crypto to many investors for the first time) and DATs devoted to accumulation of the asset. The impact on BTC and ETH token prices is evident – while it’s difficult to claim causality, we can at least say that participation by ETF investors has backed each crypto rally since launch.
We did not initially see the same behavior in ETH ETFs. More than 1 year after the first US spot products were launched, ETH ETFs have so far failed to attract a significant volume of investor capital. That was true even after the Nov 5, 2024 election of pro-crypto US President Donald Trump.
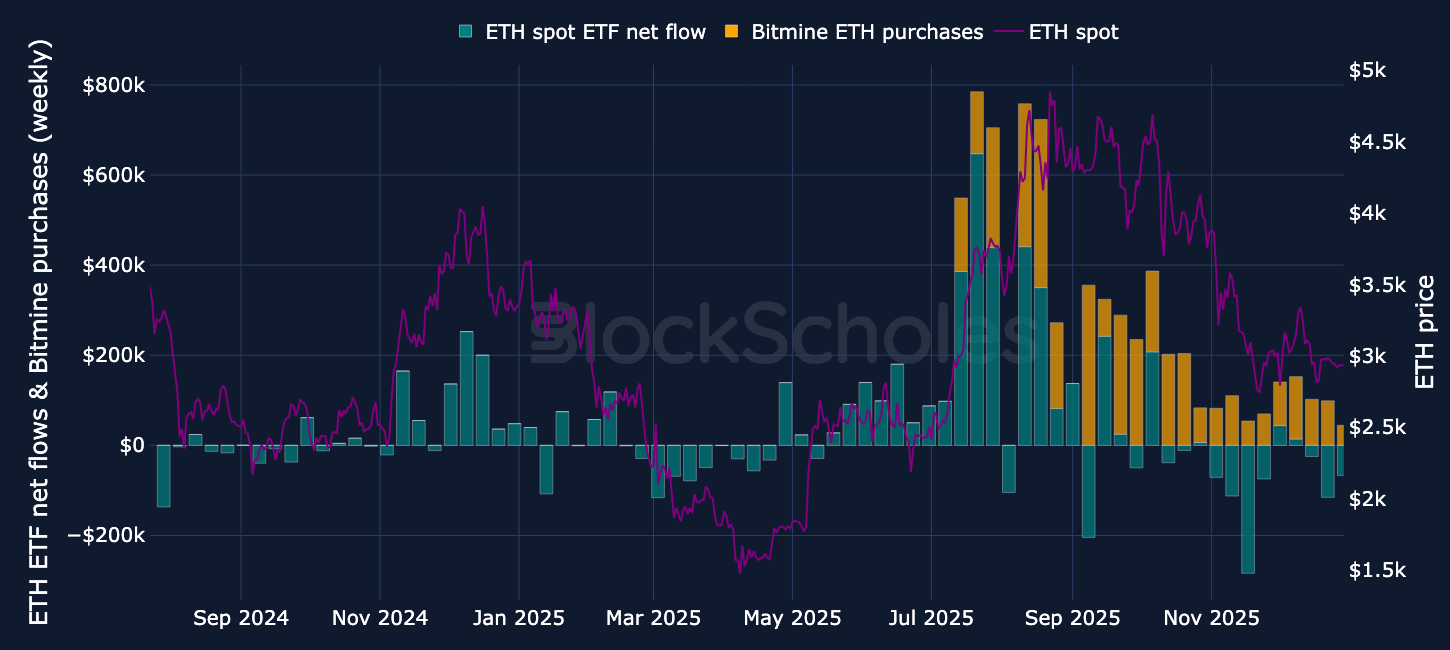
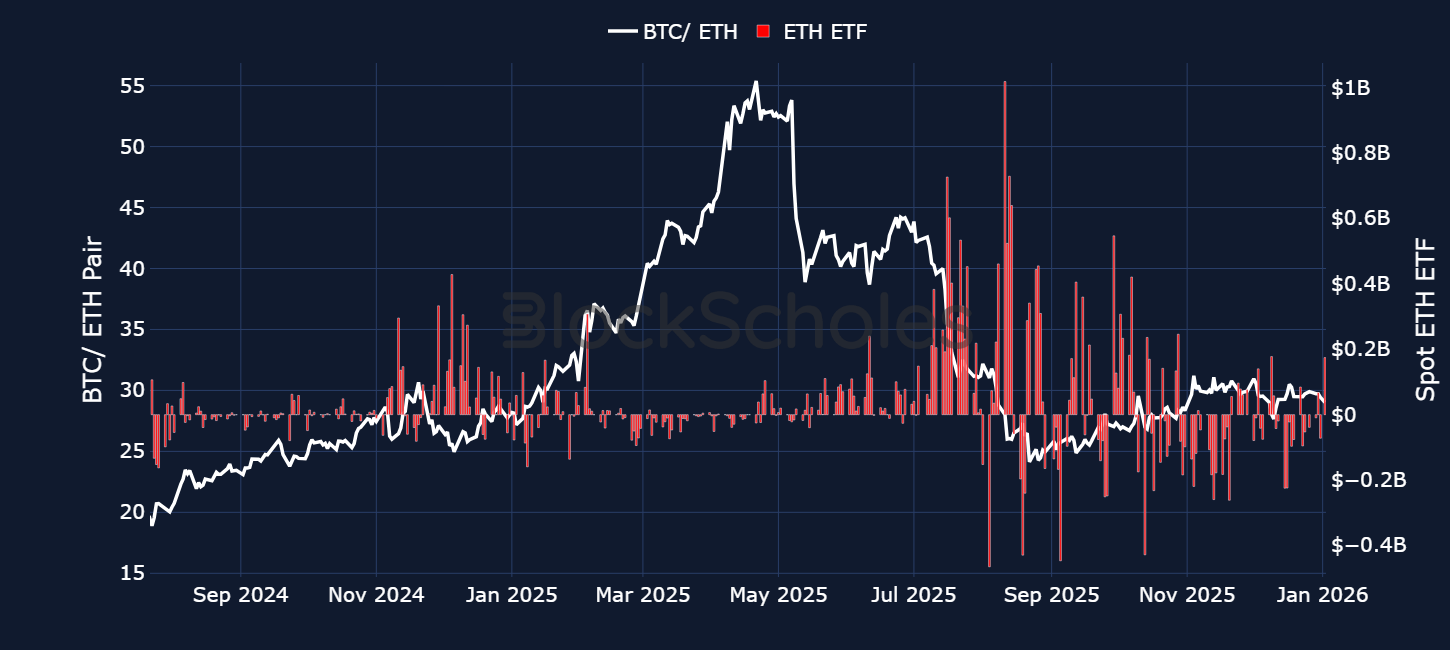
However, even this exception highlights how key ETF participation has been to crypto’s performance in 2025. It wasn’t until ETH ETFs began to reflect bullish price action in July 2025 (alongside the entrance of Bitmine, the largest ETH DAT company) that ETH spot price caught up to BTC. As the chart below shows, the value of BTC priced in ETH fell sharply, corresponding to the first inflows to ETH ETFs of note since launch.
With ETFs and DATs now driving the cycle, the timing and shape of the cycle are sensitive to a different demand cycle and the macro and regulatory backdrop that drives it.
However, until Q3 2025, those ETFs tapped a new source of demand for regulated access to crypto for BTC and ETH alone. The result is a buyer base that was more restricted in their access to crypto-assets, and therefore far less likely to “rotate” their winnings to altcoins as retail investors had in past cycles.
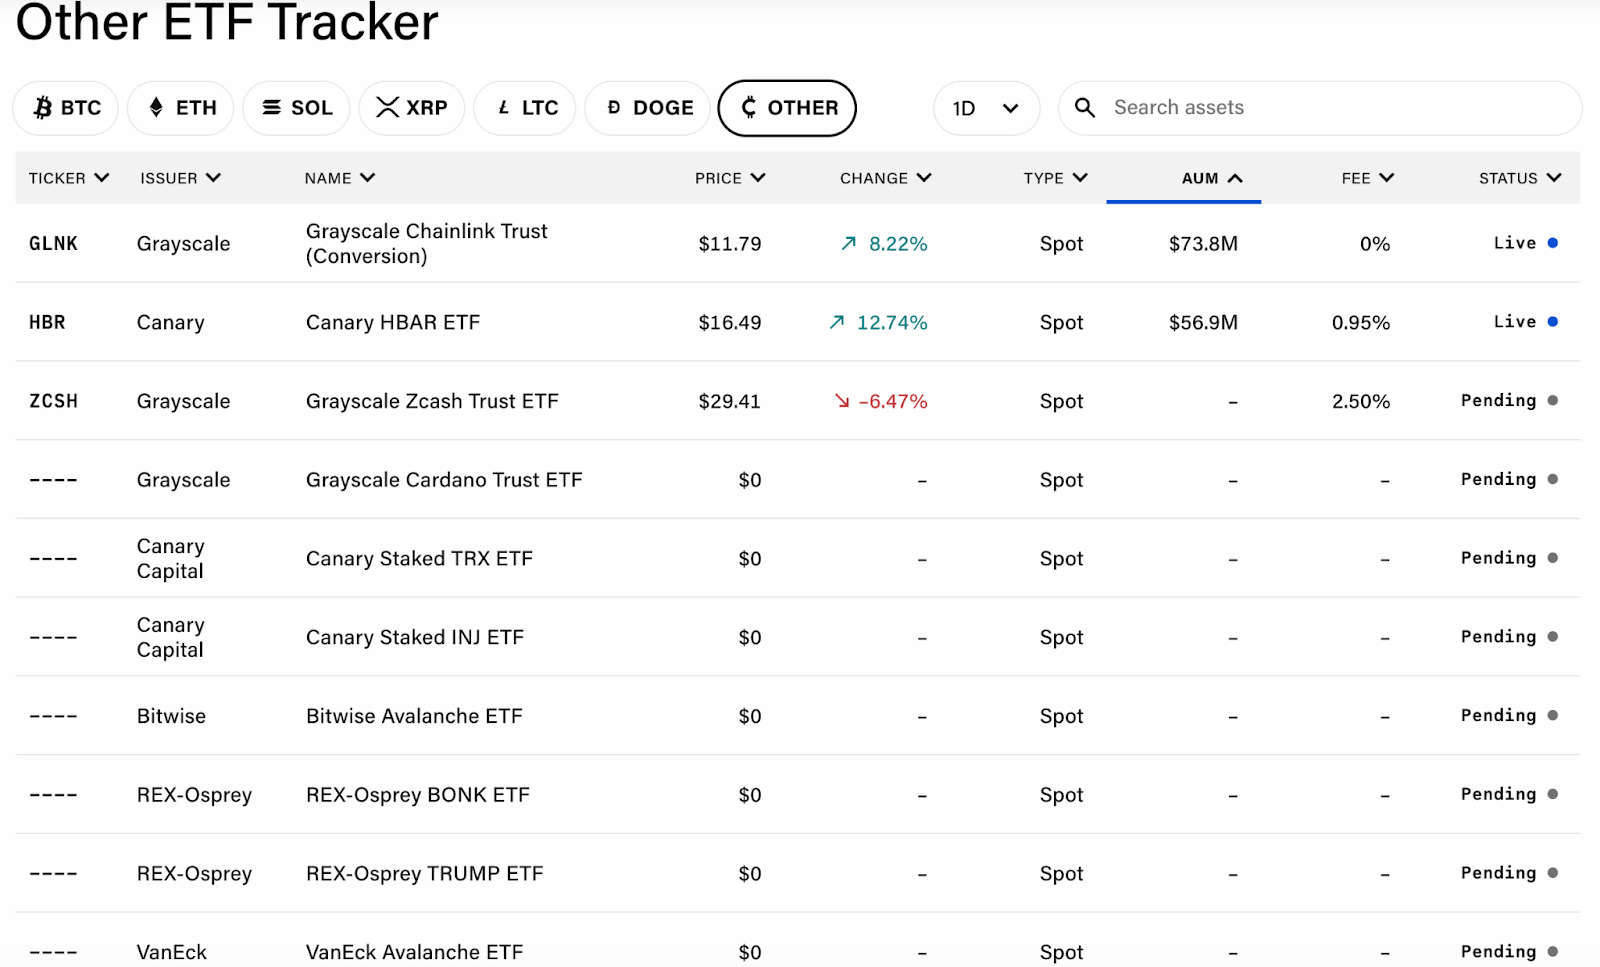
Given that ETF investors have emerged as a key main marginal buyer, any “altseason 2026” is likely to be focused on tokens that have or will soon have launched ETF investment wrappers. We have already seen the first wave of alt ETFs approved in late 2025 but most of them arrived during the October-November crypto-wide sell-off, negating any explosive launch.
As a result, the four altcoins that enjoyed ETF launches (namely XRP, SOL, LTC, and memecoin DOGE) have underperformed BTC since Oct 1, 2025. The ETF launch dates for SOL, LTC, XRP and DOGE coincide with short periods of outperformance, but none were able to sustainably buck the bearish trend.
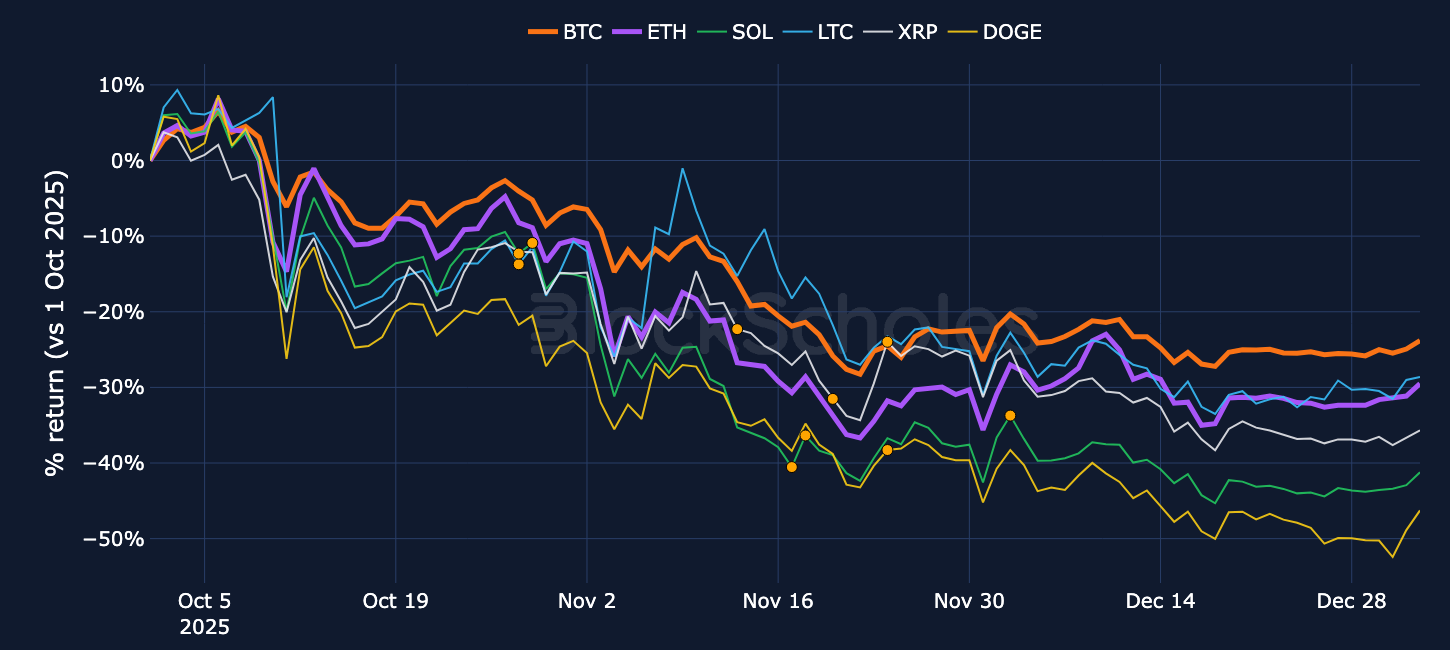
Under our framework of ETF participation as a key driver of price action, the reason for that underperformance is clear: altcoin ETFs have so far not received the same participation levels as BTC and ETH have. While US Spot BTC ETFs hold more than 6% of the circulating supply (around 1.3M bitcoins), XRP and SOL (the two largest altcoin ETFs launched in Q3 2025) have seen far less of their supply captured by ETFs.
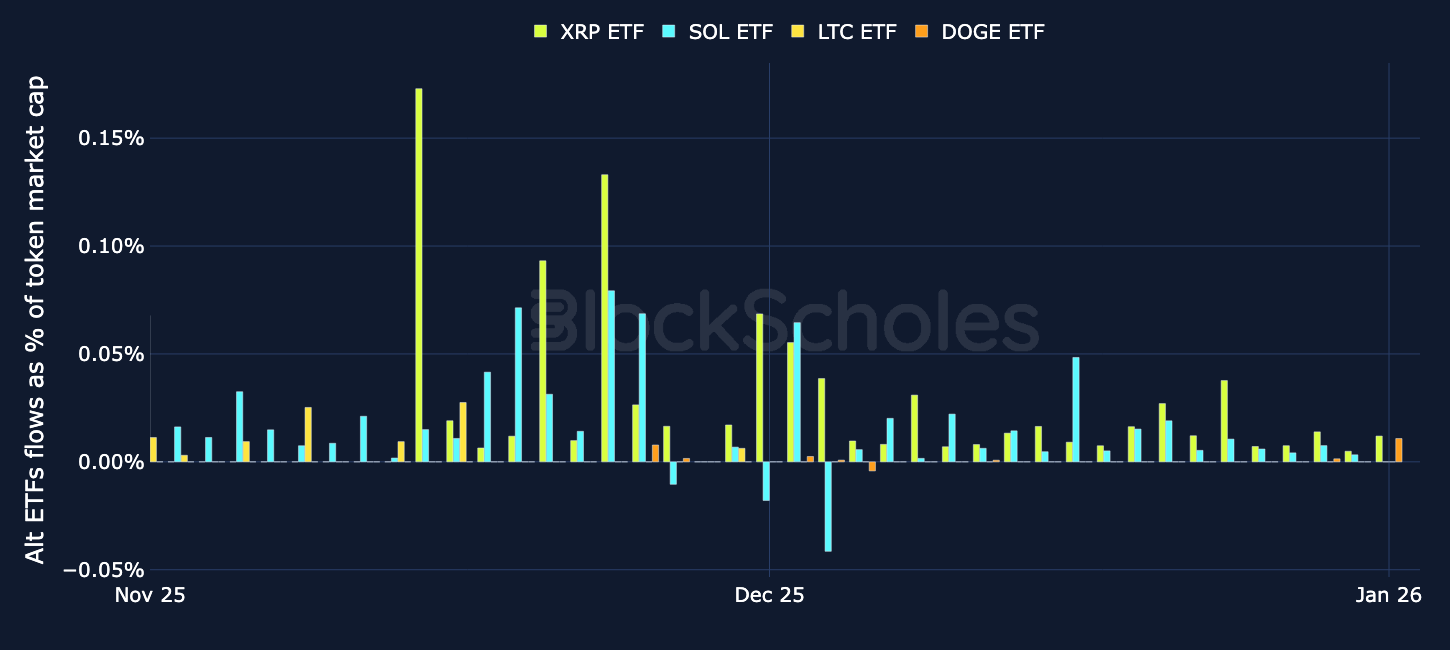
We therefore discount the lacklustre impact of ETF launches on these altcoins, which was mitigated by poor prevailing market sentiment, and await the performance of altcoin ETFs in 2026.
This year will see many more alt ETFs launch, expanding the “walled-garden” of regulated investment vehicles in which this new source of capital can roam.
However, the barrier to an ETF (and therefore access to this new source of demand) is higher than the exchange-listings that gated access in previous cycles. This means that ETF activity will continue to differentiate this cycle from others.
The other important new entrants to crypto-asset demand of this cycle are DATs, publicly traded companies whose stated aim is to accumulate digital assets on their balance sheet. While DATs have proved a sizable and reliable source of demand for assets that have driven crypto prices higher in the bull-run, the most recent market drawdown from all-time highs has reignited concerns of forced selling of those crypto war-chests due to leveraged buying.
In practice, DAT activity is dominated by two names: Strategy (MSTR, which accumulates BTC) and Bitmine (BMNR, which accumulates ETH). These two DATs hold around 3.2% of their chosen asset, each holding more than half of all tokens held by publicly traded companies. Therefore any concern of the health of DAT activity is centred on these names.
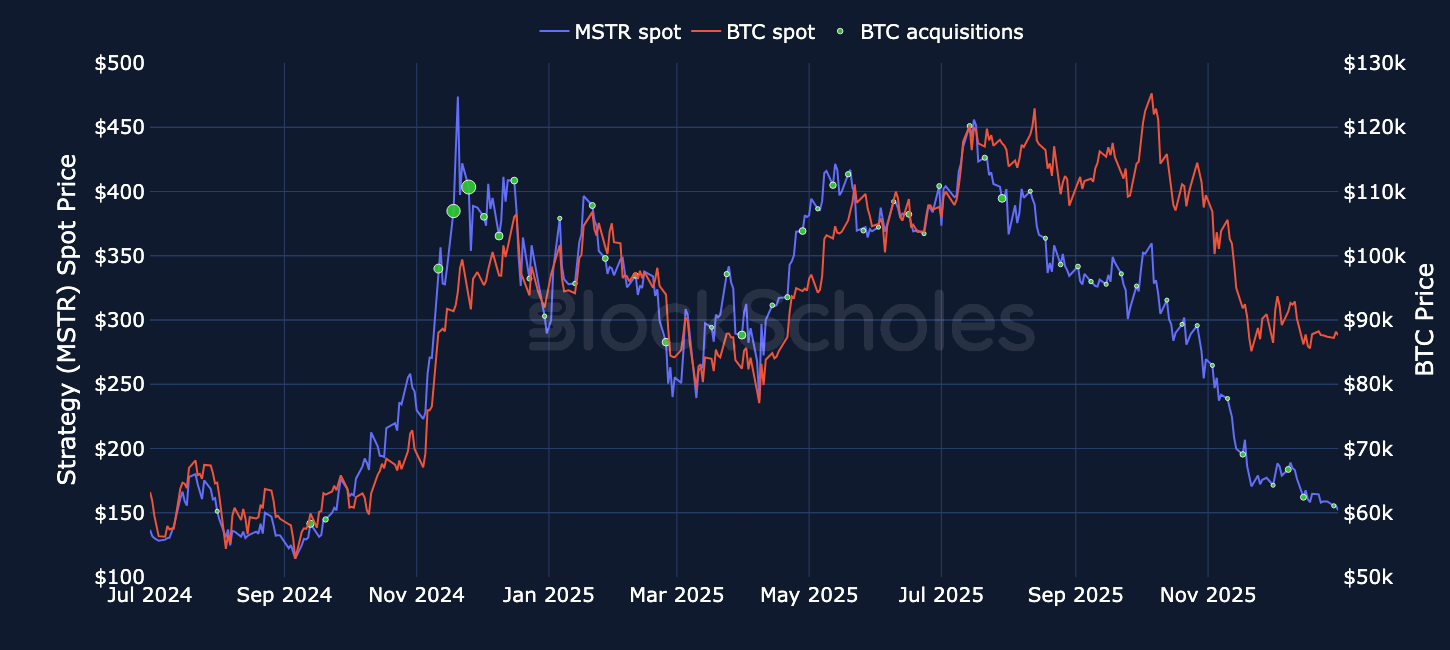
MSTR and BTC have moved in tandem throughout large swathes of the 2024-25 period. Rallies higher in BTC saw MSTR rallies harder and BTC sell offs have seen MSTR fall further. Around mid-2025, MSTR’s Spot peaked and started to fall even while BTC moved sideways. As a result, the market cap of MSTR no longer trades at the significant premium to the value of the BTC that it holds on its balance sheet.
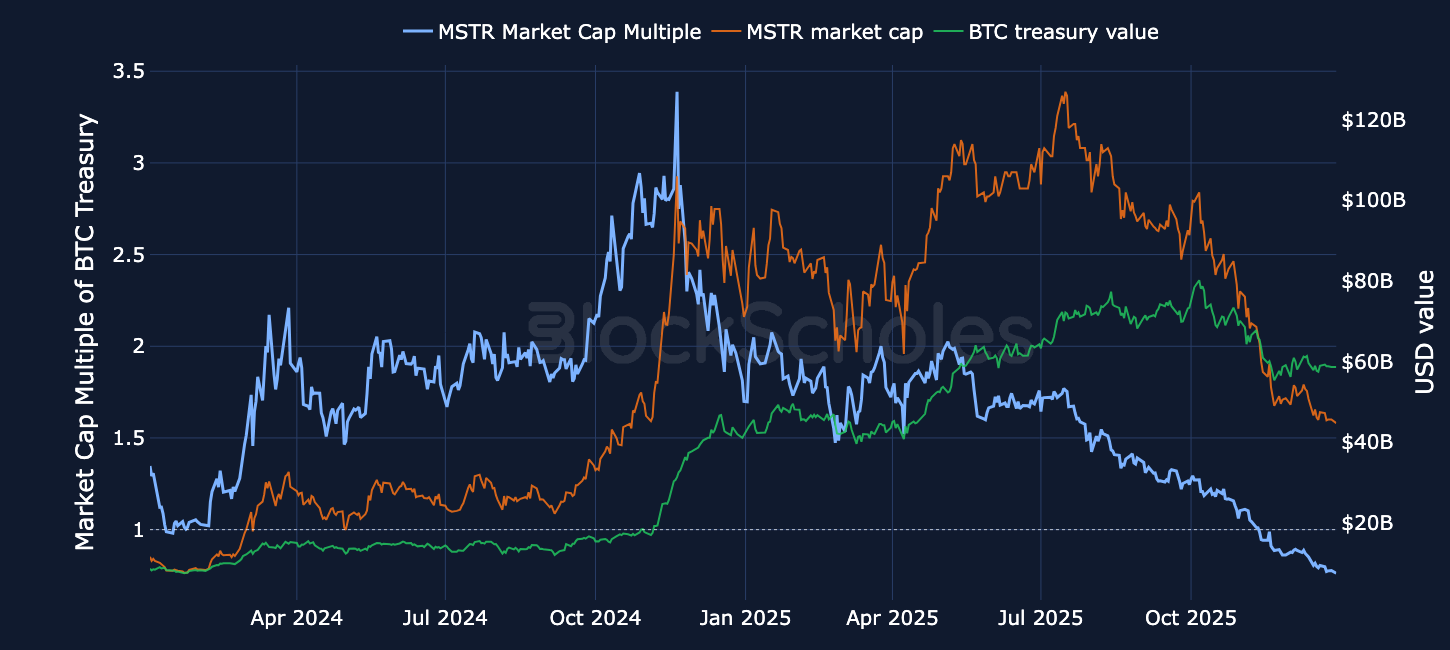
However, we do not see the premium of its stock price over the value of the assets on its balance sheet, or even its breakeven BTC acquisition price as the main risk. Rather, we see the main risk to MSTR’s stockpile (and the most likely trigger to be forced to sell that supply in the open market) as solvency for investor dividend payments. While MSTR has recently announced a large cash reserve (of $1.4B, raised on Dec 22, 2025, to $2.19B) intended to fund these payments – it is less clear how solvent smaller DATs would be under similar circumstances.
However, stock index administrator MSCI is weighing whether to exclude companies where digital assets make up 50% or more of total assets.
In a consultation decision due by 15 January 2026, MSCI may decide to exclude DAT tickers such as MSTR on the basis that they are more like investment vehicles than operating funds, and benchmark-trading managers would need to reduce exposure.
The numbers being discussed may be significant to MSTR and others in the Bitcoin DAT cohort. One estimate, cited by Reuters, suggests that $2.8B of MSTR stock could be liquidated if MSCI excludes the name, and as much as $8.8B in a scenario where other index providers are excluded. This may be a problematic scenario for DATs, given their reliance on equity issuance to fund token purchases – if index-driven outflows apply downward pressure to the share price, the companies must issue more equity to raise the same amount of cash in future fund raises.
In light of the structural shifts in demand explained above, clearly the current Bitcoin cycle has departed from the traditional four-year cycles that came before it, given BTC’s tight macro integration and the onboarding of institutional demand.
However, in this report, we probe further as to whether the traditional four-year cycle ever really existed in the first place? Is there an argument to be made that, instead of a supply-driven four year halving cycle, every post-halving rally in BTC has instead actually lined up with a rise in global liquidity levels?

The first BTC halving took place on Nov 28, 2012. During that period, interest rates in the US were close to 0%. Not only were rates low to stimulate the economy, in September 2012, the Fed announced the start of ‘QE3’. By December of that year, it was buying $85B worth of US treasures and mortgage backed securities per month collectively. That pushed the Fed’s balance sheet from $2.9T to upwards of $4T by late 2014.
Between 2016-18, the Fed was not cutting rates nor growing its balance sheet. Instead, it was both normalizing policy by raising rates and normalizing its balance sheet by reducing its size. However, global liquidity levels were still increasing over this period, driven by quantitative easing from other central banks: the BoE, the BoJ, and the ECB.
In the last cycle, the May 2020 halving coincided with the Covid-driven quantitative easing program which saw the Fed grow its balance sheet by more than double to $9T; the subsequent rally in BTC took it from under $10K to a high close to $70K. Finally, after the April 2024 halving, once more the rally in BTC coincided with a slower, yet still increasing, move higher in global liquidity levels.
When we plot BTC alongside global M2 levels, we also uncover how the entry of institutional buyers rewrote the dynamics of the cycle. In early 2024, global liquidity levels were flat, while BTC surged from $40K to surpass its November 2021 high. That coincided exactly with the launch of Spot Bitcoin ETFs.
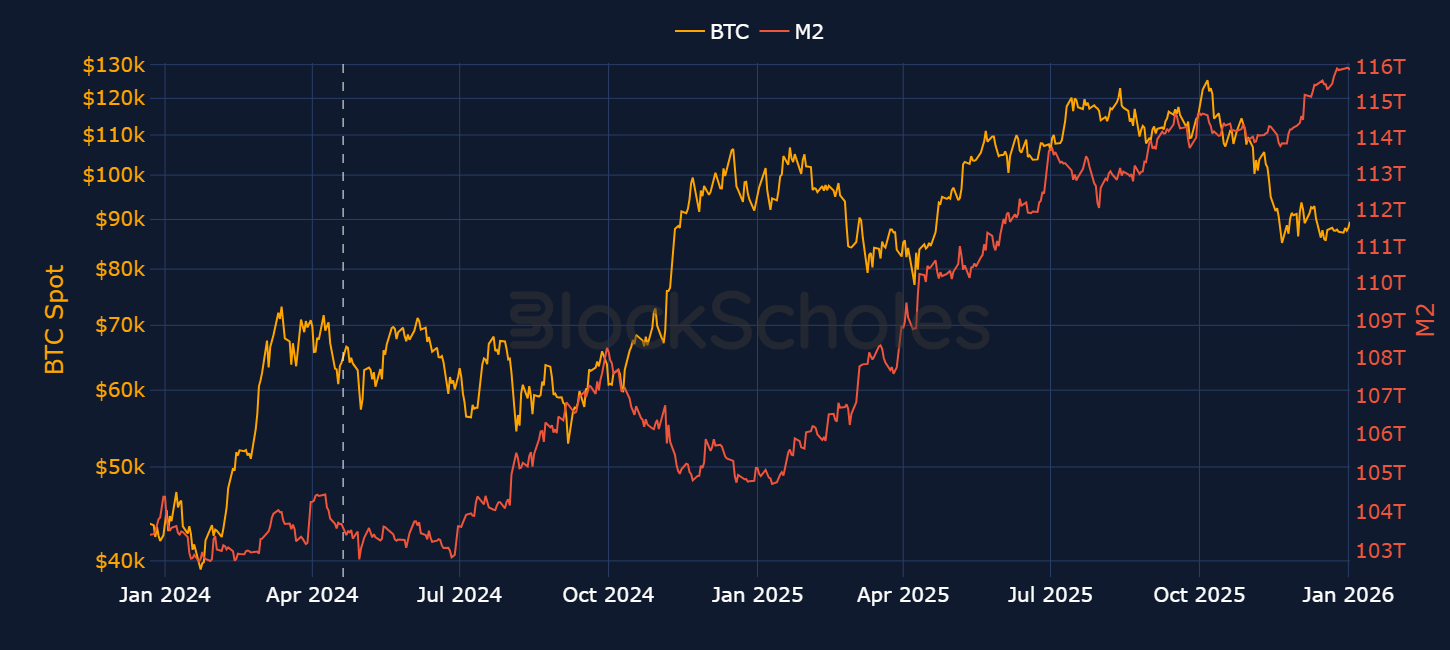
Whether previous cycles have been driven by liquidity or not, the bull-run in 2024-2025 has made one thing abundantly clear: macroeconomic conditions cannot be ignored by any crypto investor.
If this cycle has been different to previous bull-runs, do we expect a subsequent bear-cycle? In this section, we explore what else could drive BTC and crypto-asset returns in 2026 if not the four-year cycle, which would suggest a bear market.
Given the more unique nature of this crypto cycle, we believe that three key drivers, namely macroeconomic sentiment, supply and demand factors, and regulatory advancement, are likely to continue being the main drivers of spot prices in 2026.
We’ve already covered in the previous sections how supply (the halving) is having a smaller effect on spot returns, and the implications of a new, unique to this cycle, source of demand — institutions. So what is in store for the macro environment?
Since BTC’s tight integration into the macro universe, its movements have become an almost corollary to risk-on sentiment — when risk appetite is high, BTC and US equities have rallied together. In periods of risk-off, they’ve both sold off e.g., April 2025. Given the fact that BTC continues to trade as a risk-asset, one of the core macro factors influencing our 2026 outlook for crypto is a continuation of the Fed’s latest cutting cycle which essentially began in Sept 2024, with a pause during the first 9 months of 2025 before resuming with 3 straight rate cuts between September through December 2025.
DECODE: A Fed rate-cut regime has historically been bullish for risky assets.
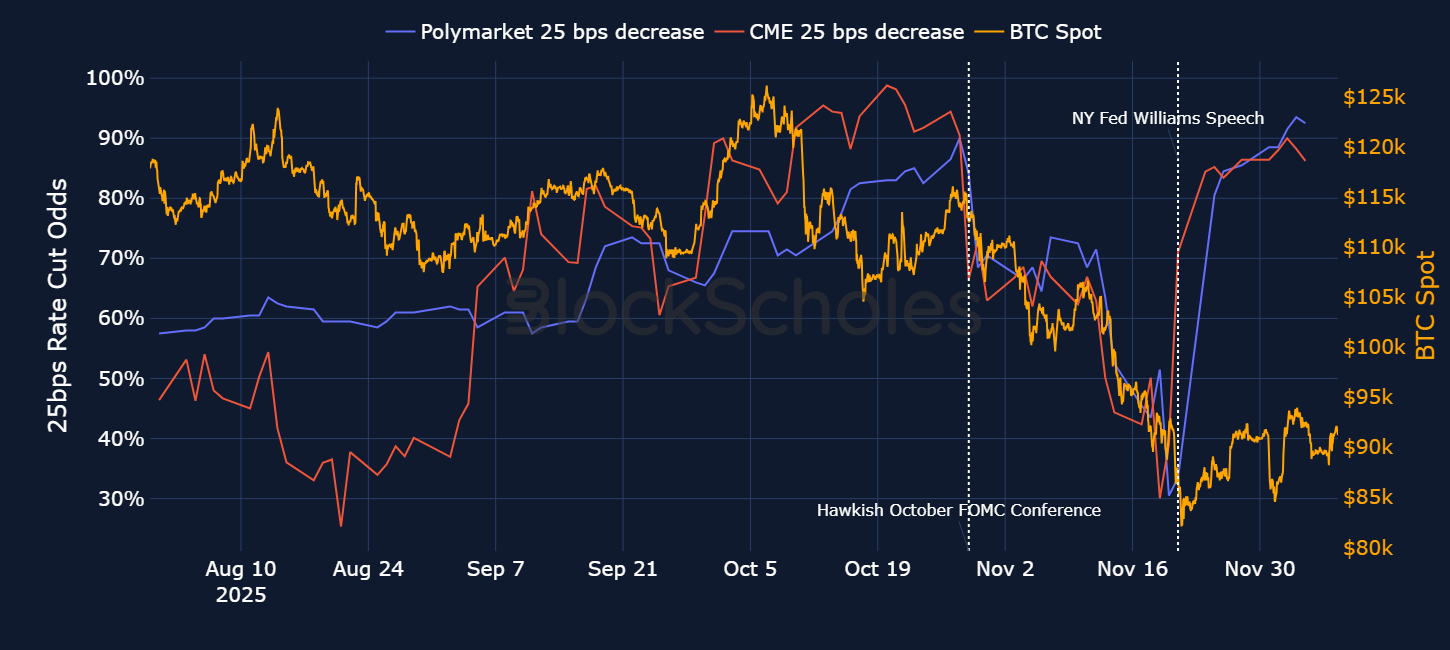
Figure 16 above illustrates just how important the cutting cycle has been for risk-sentiment.
Recent “Fed speak” also lends credence to BTC’s sensitivity to shifting expectations surrounding Fed rate cuts, while recognizing that cryptos have mostly remained rangebound since the dramatic liquidation event in early-October 2025.
Following the Fed rate cut on Oct 29, 2025, Chair Powell said “a further reduction in the policy rate at the December meeting is not a foregone conclusion, far from it”. Shortly after, a slew of Fed speakers also indicated their willingness to hold rates. As a result, through the month of November, both Polymarket implied odds and odds implied by 30 day Fed Funds futures sharply repriced their expectations for a December cut. That coincided with a slow drift lower in BTC spot price from $110K.
Sentiment changed on Nov 21, 2025, however. The probability of a December cut surged from 30% to 70% following a speech from New York Fed President John Williams, who said he still sees “room for a further adjustment in the near term to the target range for the federal funds rate.” Those changing odds marked a local bottom in BTC’s spot price and then coincided with a spot recovery. While BTC modestly recovered, it did not return to the levels it initially fell from, as we might have expected given the changing odds. Why is that?
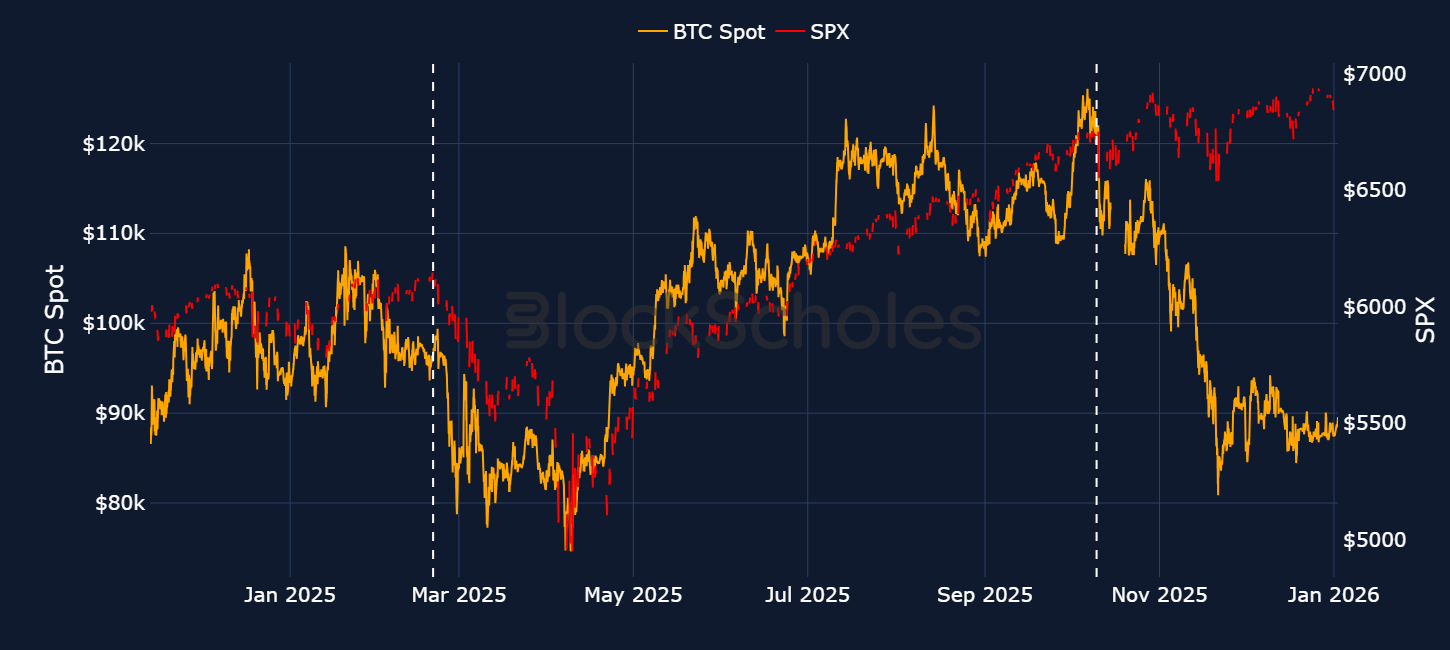
The Oct 10, 2025 liquidation event has wobbled what has otherwise been a strong relationship between BTC and US risk-on equities. 2025 ended with the S&P 500 closing 16% higher, while BTC ended the year down 6%. A scatter plot of BTC against the S&P 500 highlights that underperformance and showcases how the relationship bent post-Oct 10, 2025. Both assets are still moving in line with each other, dropping and rising together, but BTC has massively underperformed in almost every move.
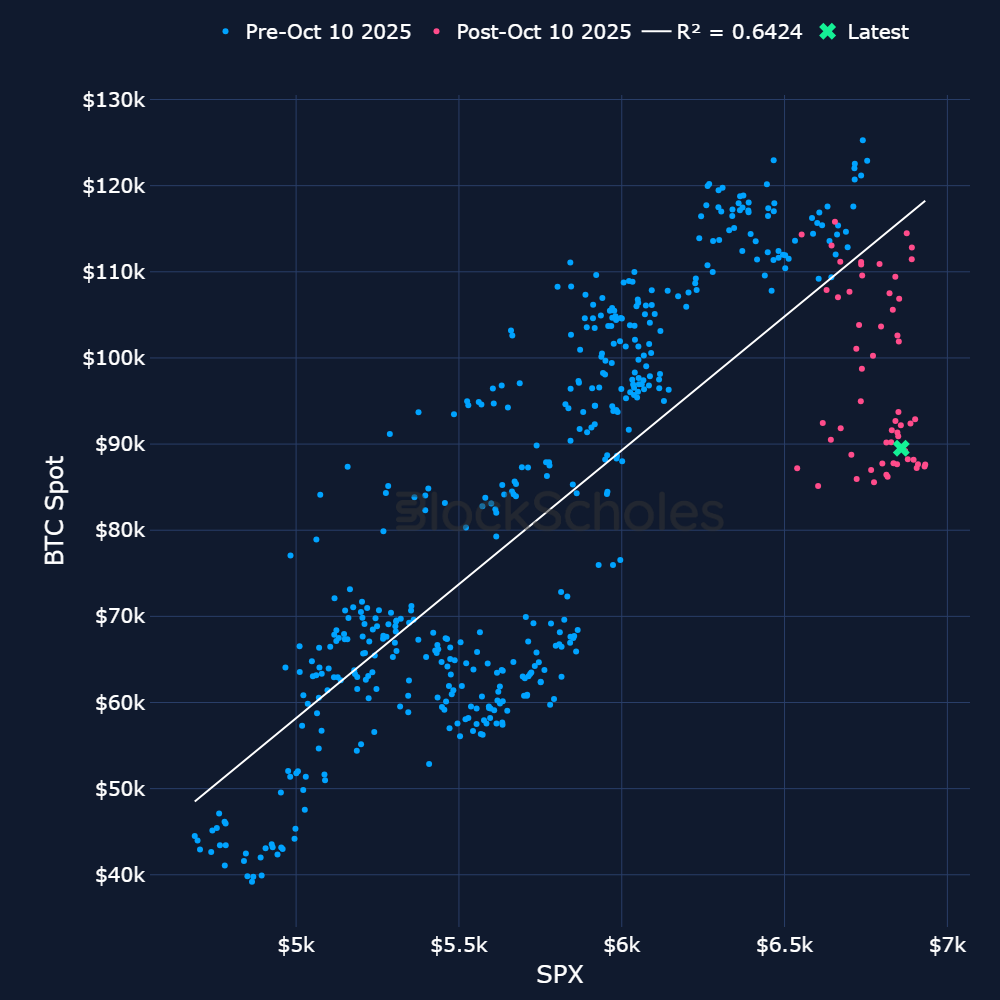
In fact, the linear relationship between the two assets since 2024 implies BTC should be trading closer to $120K (roughly the level it fell from on Oct 10, 2025), given where the S&P 500 currently trades.
We’ve seen price deviations like this in the past, such as in late February 2025 during the buildup to the April “Liberation Day” tariff announcement. Back then, BTC and the S&P 500 both fell together, but it was BTC that recovered earlier, while US equities lagged behind. As shown below, BTC fell from $98K on Feb 21, 2025 to a low of $75K; however it recovered exactly back to $98K by mid-May. On the same Feb 21, 2025 date, the S&P 500 traded at $6,100 — however, it would take until late June to recover — a month’s difference between BTC’s recovery and S&P 500’s recovery.
However, once US equities did recover, the relationship refreshed anew — therefore providing recent evidence that temporary deviations in the relationship have not lasted long.
To be clear, the relationship between BTC and the S&P 500 remains positively correlated on a 30-day rolling basis. While the positive correlation has waned since its 3-year high in November 2025 and now fallen into sub-0.50 levels which suggests some slack, it’s not much of a stretch to think that the BTC-SPX relationship may yet be reinvigorated.
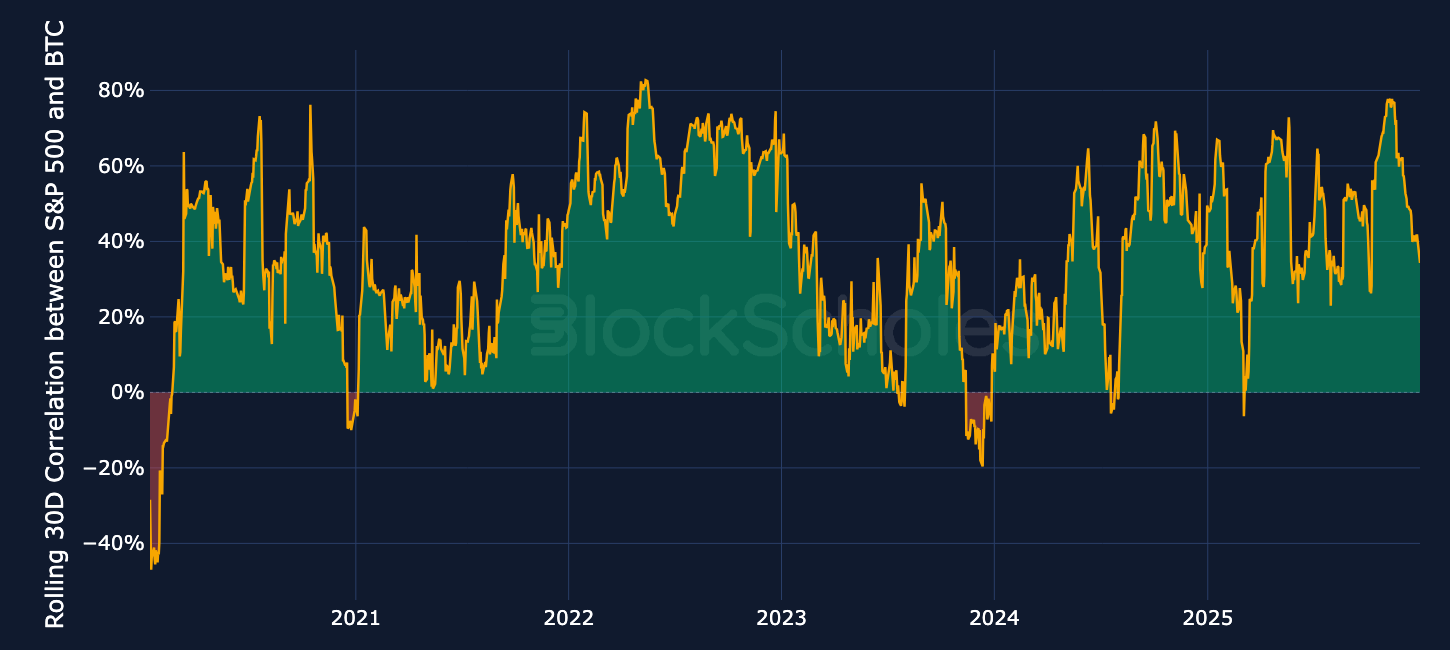
As such, the current dislocation can resolve in a number of ways: the relationship remains wobbled thereby seeing BTC continue to underperform, or, the relationship converges again, providing a potential avenue to see BTC snap back up in 2026.
There is certainly reason to see the latter occur: Bitcoin catching up this year.
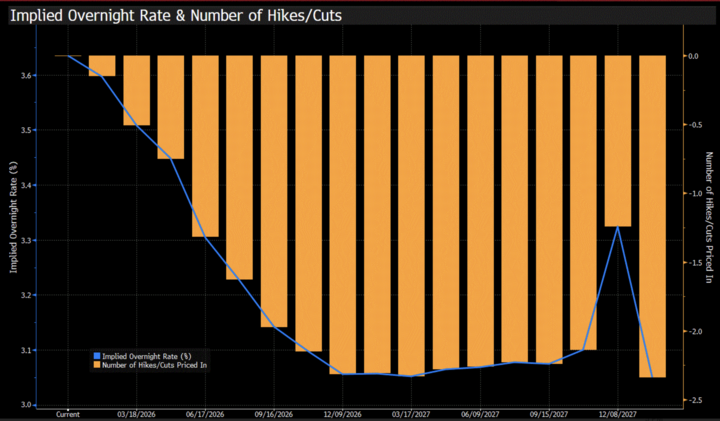
The FOMC voted to continue their cutting cycle in December, and the updated Summary of Economic Projections show that the median FOMC participant expects one rate cut in 2026. Markets on the other hand, are optimistic for even more cuts than the median SEP projection — Fed Fund futures project two more cuts in 2026, with a 42% chance of three or more rate cuts this calendar year.
All else held equal, a continuation of the cutting cycle is supportive of risk-on assets (we’ve covered the channels through which a rate cutting cycle from the Fed has historically benefited risk-on sentiment in previous editions, see here).
Additionally, assuming the relationship to US equities is regained, the risk-on rally has the potential to be even greater in BTC, given that it has been underperforming the S&P 500.
That supportive foundation may also be amplified by market’s current expectations for who President Trump is likely to nominate next as the Chair of the Federal Reserve.
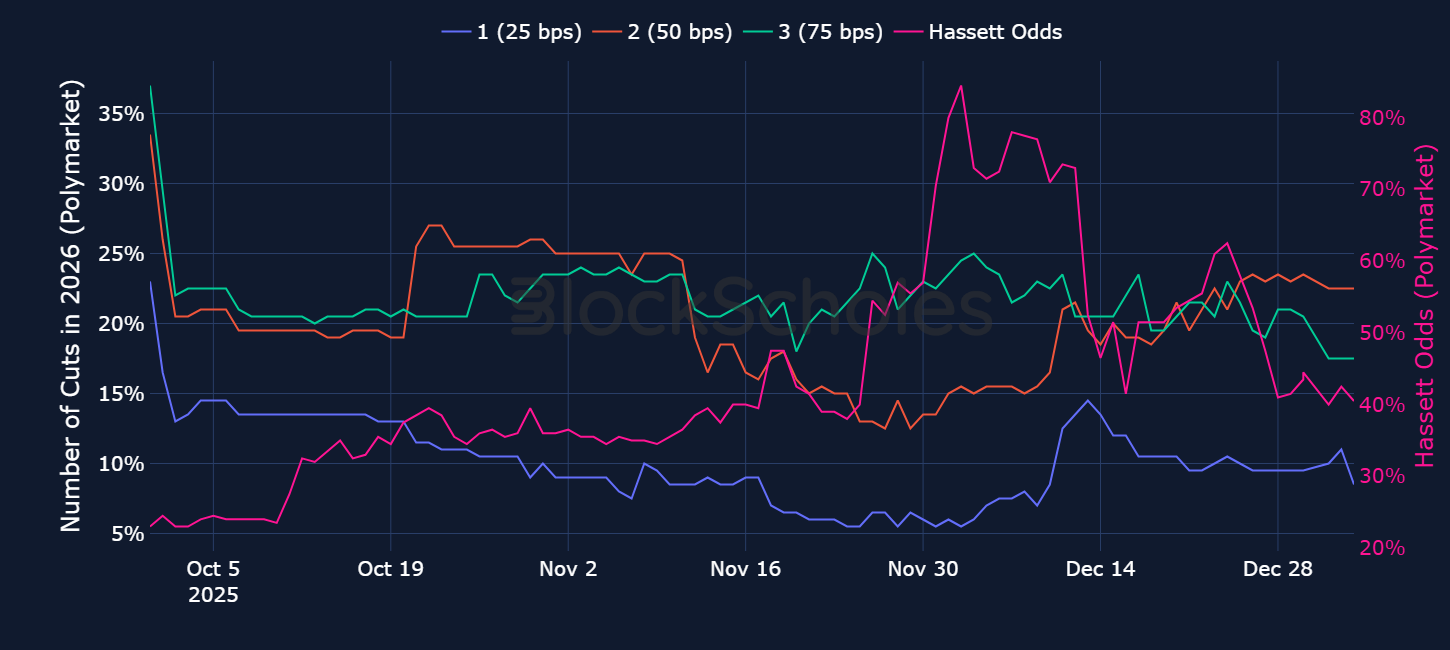
Frontrunner Kevin Hassett, current Director of the National Economic Council, has made clear his dovish stance on monetary policy. On Nov 20, 2025, he told Fox News that he would “be cutting rates right now” if he were the chair of the Fed because “the data suggests that we should.”
However, while a more dovish Chair may help influence the rest of the voting committee to a more dovish stance, it cannot be guaranteed as the chair alone does not determine policy. Indeed, the Fed’s December dot plot shows just how diverse views on the committee are. Markets are showing an awareness to the fact too: longer term rate cut odds do not appear massively affected by Hassett’s probability of becoming the next chair.
President Trump’s nomination for the next chair, even if not Hassett, will almost surely hold a dovish policy stance. If the US bond market, perhaps more specifically so-called bond vigilantes, see that as a threat to Fed independence, bond yields may still rise even in spite of a dovish member advocating for a faster cutting cycle, which might counter some of the easier financial conditions provided by rate cuts.
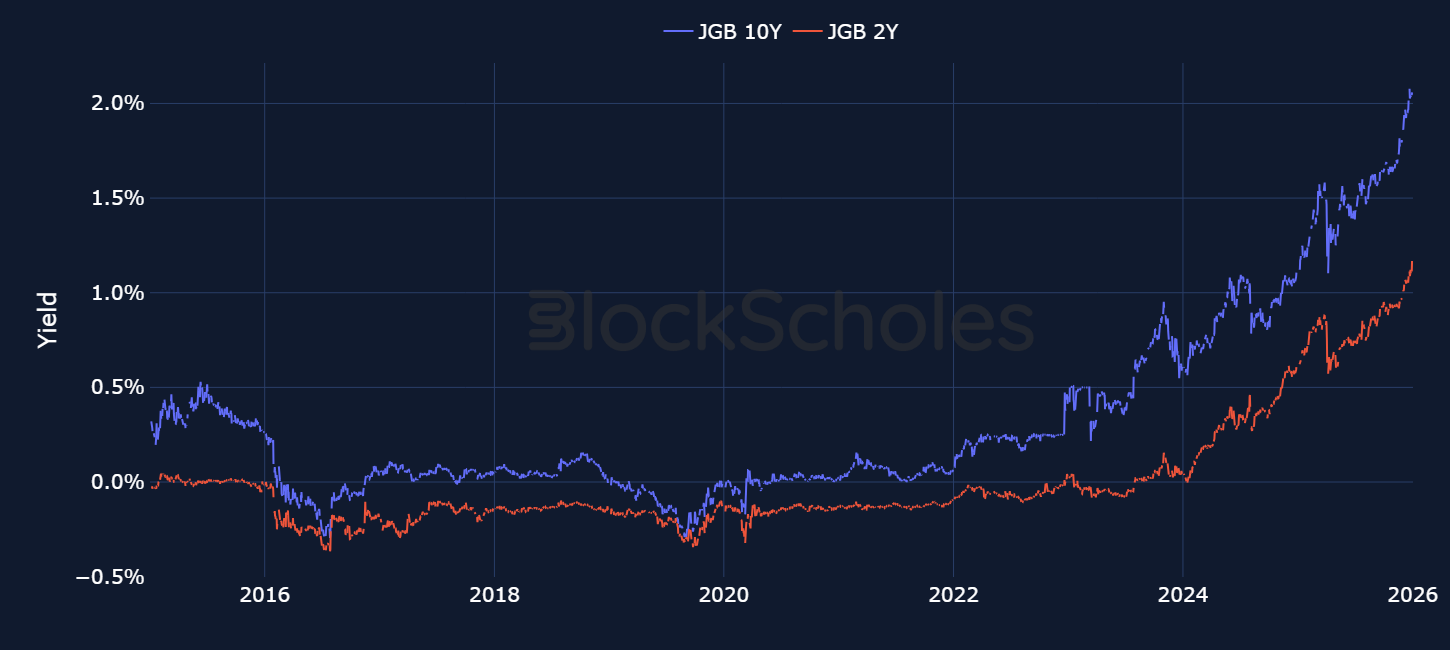
One major risk to our 2026 macro outlook is a potential risk-off period in 2026 triggered by violent moves in Japanese government bond yields and the yen carry trade. The yield on 10-year Japanese Government Bonds (JGBs) has risen from near 0% to around 2.1% within four years — levels last seen in 1999. There have been many drivers of the move higher in JGB bond yields, including: monetary policy normalization (interest rate hikes, fiscal spending from the new Takaichi government, and Japan having the highest debt-to-GDP ratio (230%) amongst developed nations.
Continued hikes to interest rates from the BoJ risk increasing the mark-to-market losses of existing holders of JGB bond yields (of which banks, insurance companies and pension funds make up 40%). Higher Japanese interest rates also harm local Japanese corporations who finance their operations through credit and borrowing. That higher cost of borrowing firstly puts pressure on corporate funding and could have a major impact on credit markets, and secondly, higher borrowing costs put pressure on Japanese equity prices due to the higher discount rate applied to future earnings.
The potential of a sharp repricing in Japanese assets could then spillover to global risk sentiment, potentially resulting in a selloff at the higher end of the risk curve, such as cryptocurrencies.
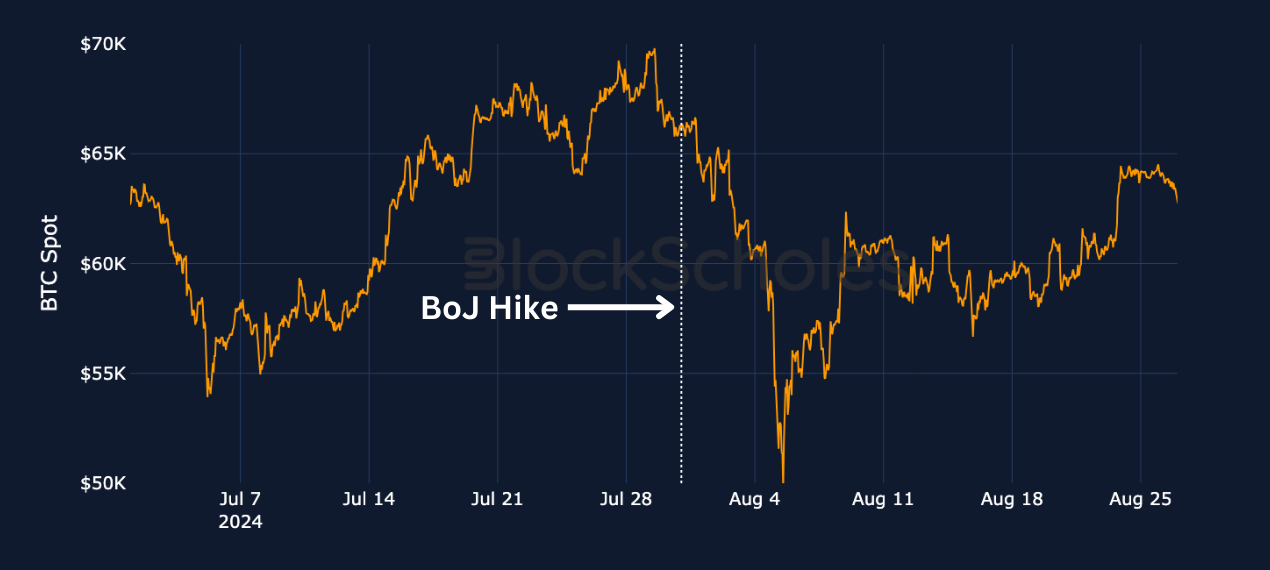
There is another channel through which macro risks exist, and that’s through the foreign exchange market. The Japanese yen has long been used as a carry trade. One such example is institutional market participants funding themselves in the Japanese yen and buying US treasuries. One of the main factors (among others) that keeps this trade profitable, is when USD yields remain above JGB yields. One risk to the carry trade is the USD-JPY currency rate reaching a level at which institutions engaged in the carry trade are forced to unwind some of their leverage. Such was the case when the USD-JPY plummeted in Aug 2024 following a surprise rate hike from the BoJ.
DECODE: The yen carry trade involves borrowing the Japanese yen at the ultra-low levels of interest in Japan and then using the funds to invest in higher-yielding assets, whether that is the US treasuries, global equities or cryptocurrencies.
While the risk of higher yields on JGBs primarily concerns the Bank of Japan, the carry trade is sensitive to both the BoJ’s monetary policy and the monetary policy of other central banks, such as the Federal Reserve. If the latter begins to cut interest rates faster than expected and subsequently brings down longer-end US treasury yields, that may then also cause traders to unwind carry trades. As such, the spread between US and Japanese government bond yields is also worth watching in 2026.
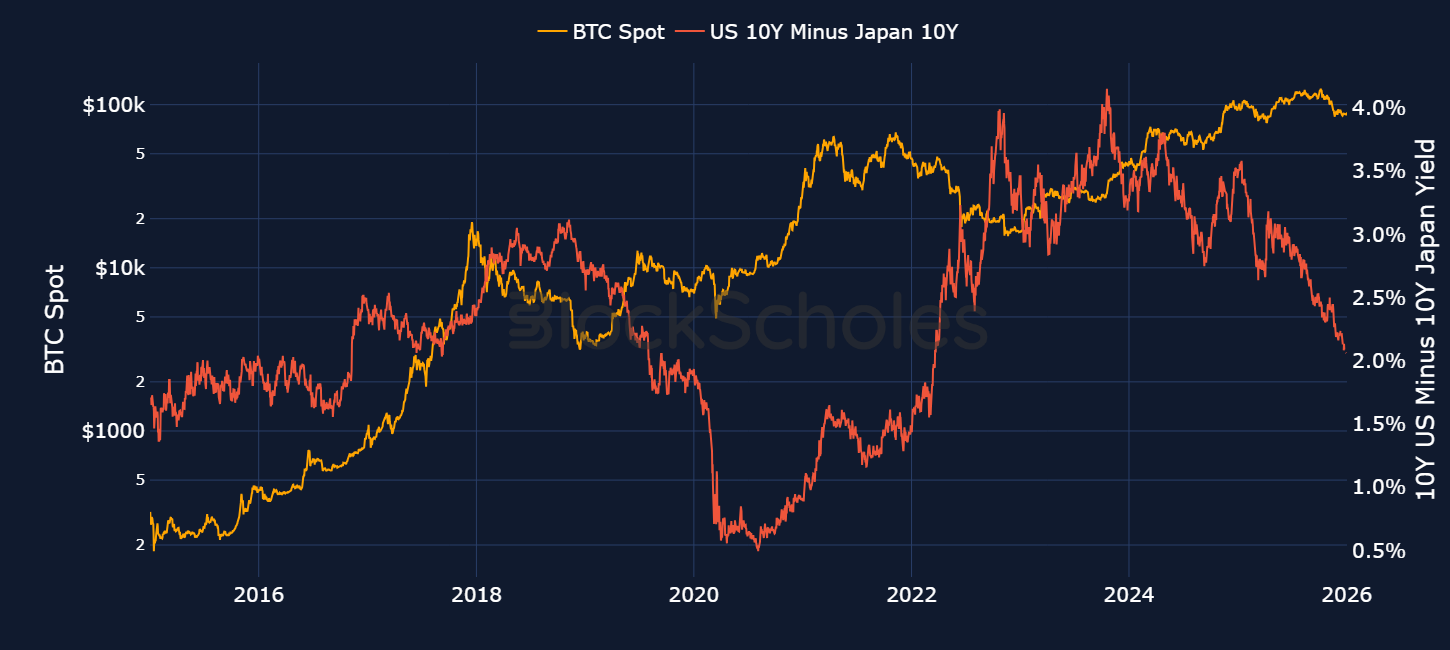
For most of last year, that spread has narrowed as US 10Y yields slowly fell from their highs at the start of 2025, while JGB yields have continued to increase. However, extreme moves in that spread could drive a sharp repricing of risk. Ultimately, we see two major risks from Japan to our macro outlook, which crypto markets will need to navigate through alongside the macro tailwinds mentioned in previous sections.
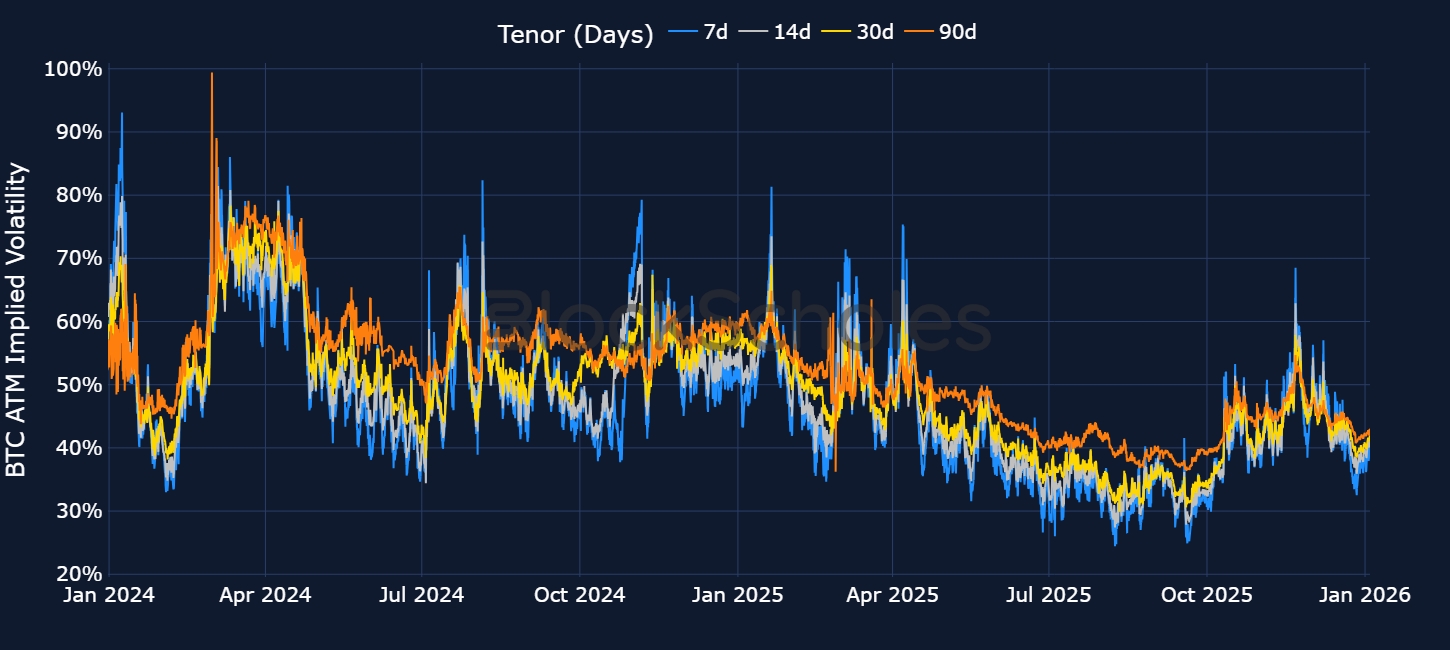
For most of 2025, we consistently highlighted that BTC options markets traded with lower levels of at-the-money implied volatility.
DECODE: Implied volatility is a forward looking measure of the volatility traders expect over a fixed time horizon.
Through last Spring and Summer, that low volatility was unique to BTC — ETH traders priced-in significant levels of volatility during spot price selloffs or rallies, while BTC traders did not. As a result, we saw a large increase in the ratio of ETH’s ATM IV relative to BTC’s across all time horizons.
We’ve attributed partly this to the arrival of institutions: many funds and large institutional players (such as DATs) are likely to be, on the margin, sticky sources of demand than retail investors in previous cycles. In addition, we’ve shown that those same large institutional players have engaged in the systematic selling of options, using strategies that have typically been deployed in the TradFi options space. DATs, who have recently seen the pressure they can come under during periods of drawdowns, are likely to be inclined to engage in activities such as selling calls and OTM/ wing options in order to earn yield, cheapen entry to token acquisitions, and protect against downside.
The combination of these two factors has resulted in the suppression of large volatility spikes for which BTC is notorious.
We expect such “volatility-suppressing” activity to continue and even expand in 2026, implying a structural weight on implied volatility levels.
Still, we find evidence that the “maturation” of crypto that was forecast by the arrival of institutions has not yet completely ‘killed’ volatility. The Oct 10, 2025 liquidation event proved that BTC still has volatility when it needs it. It had a long-lasting impact on options markets too: in the subsequent drift in spot prices post-Oct 10, 2025, we saw short-dated skew drop to its lowest level all year on Nov 21, 2025, when BTC fell to $82K.
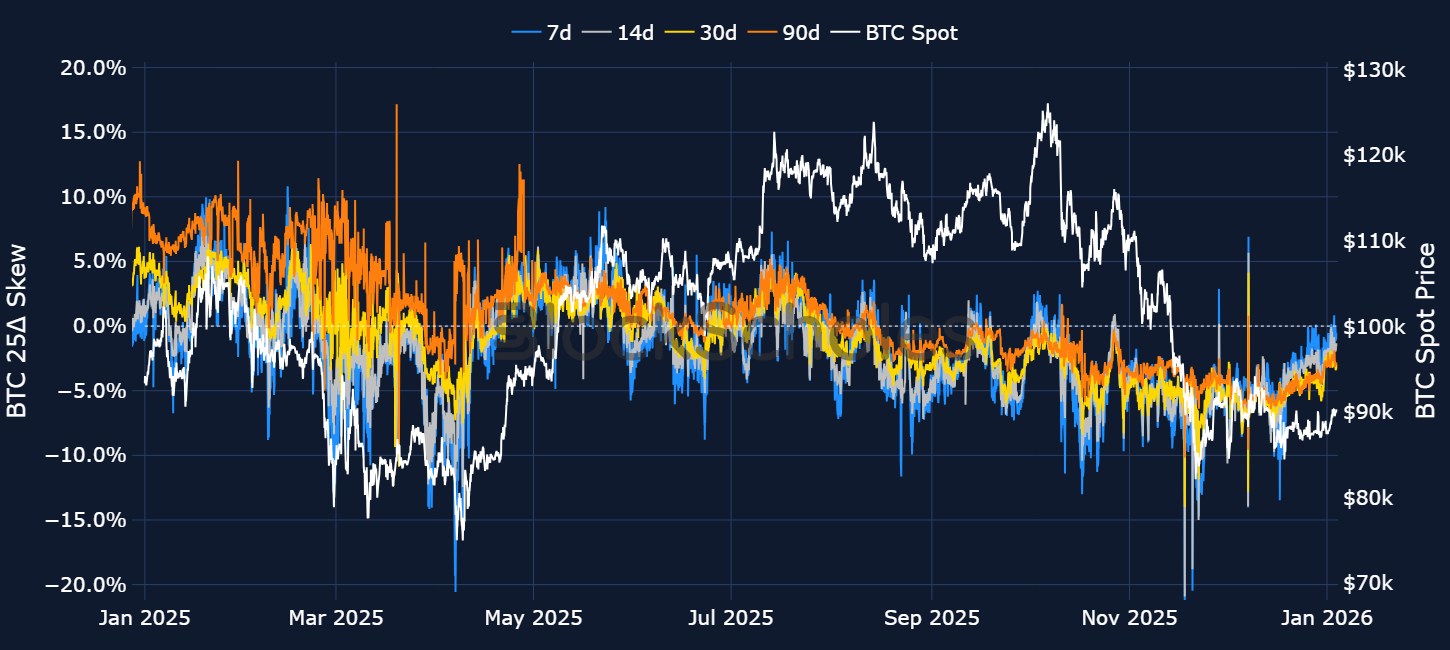
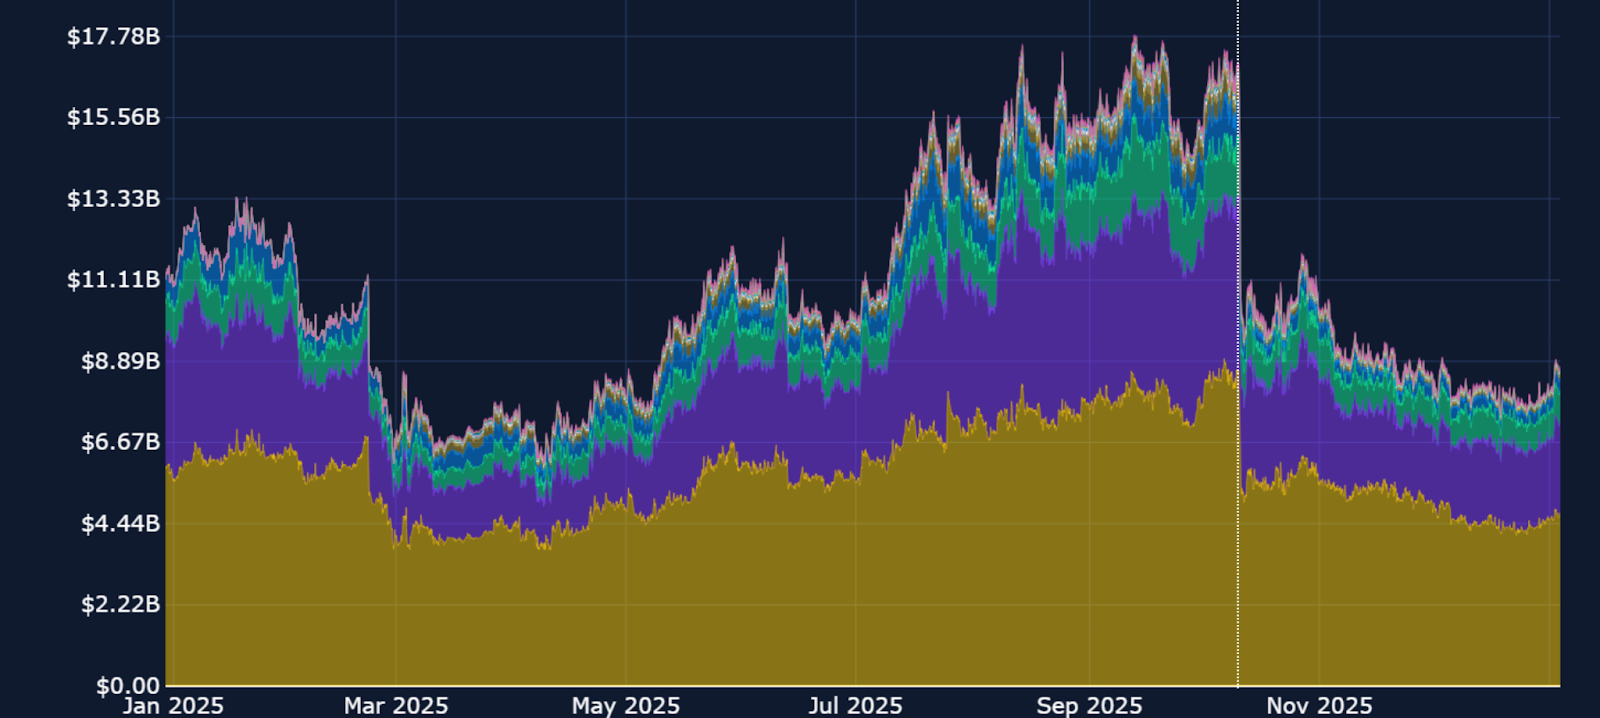
The liquidation event has also gone a long way in denting risk appetite among retail traders. Since the event, open interest levels are still far from recovering the levels they fell from.
Together, current positioning in derivatives markets suggests lower retail participation and a market that is continuing to expect more bearish price action at least heading into, and in the first few months of the new year.
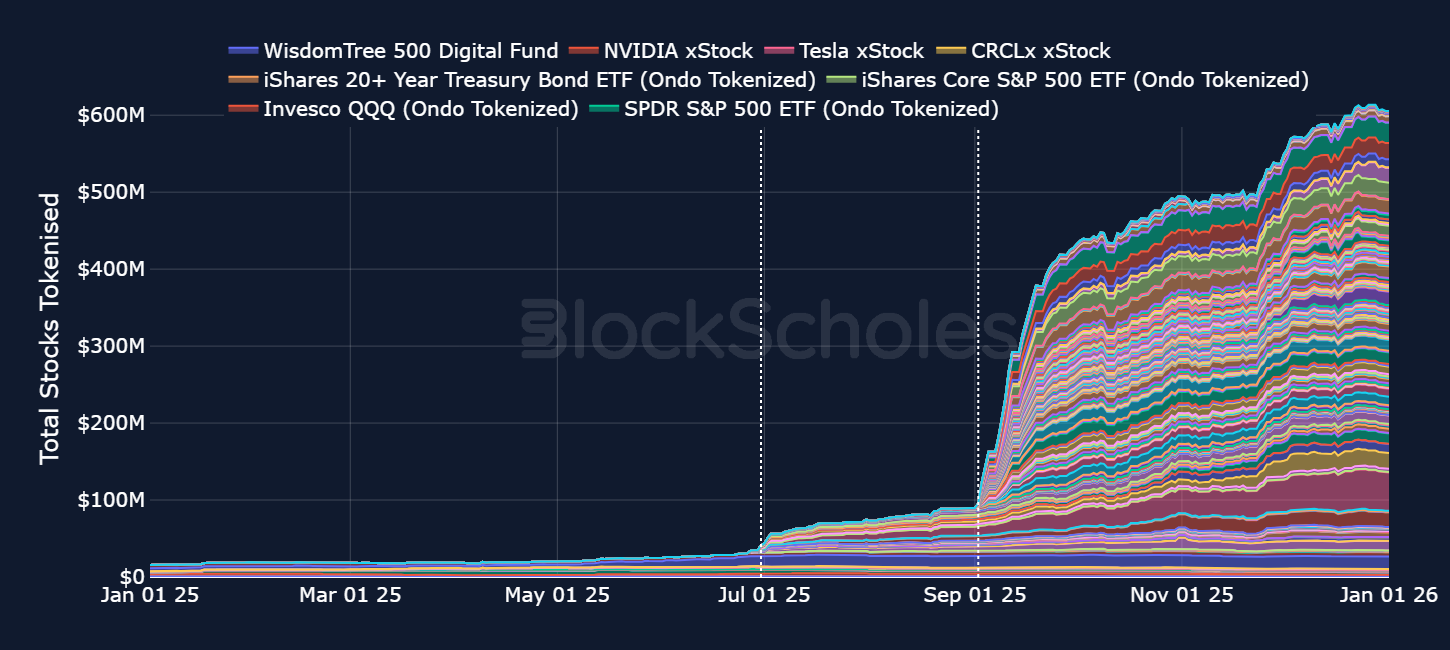
In 2025, growth in tokenized assets in crypto was driven by a combination of institutional participants seeking the operational simplicity offered by the blockchain and retail users looking for the ease of holding a consolidated portfolio of tokenized “trad-fi” products alongside crypto-native tokens.
DECODE: A tokenized asset is an on-chain representation of an off-chain asset; for example, 1 USDT or USDC represents $1 off-chain, as opposed to truly holding the underlying.
For example, tokenized equities markets have approached $600M in outstanding tokens (as shown in the chart below), while treasury markets, which operate 24/7, have already surpassed billions in daily settlement volume in 2025.
However, tokenizing traditional assets is not without its problems:
One emerging, crypto-native solution is RWA perpetual futures (perps), derivatives without expiration that provide directional exposure without requiring ownership of the underlying asset. In fact, perps do not require borrowing or holding the underlying asset at all. When you take the short side of a perp, you receive pure directional exposure to price with P&L settlement via margin. This makes perps operationally simpler, heavily reduces counterparty risk, and solves the “redemption only in market hours” dilemma created by tokenized assets.
In 2026, rising adoption will leave blockchains with more value, users, and infrastructure to protect—making stronger security measures a forefront of developments. As advances in quantum computing place increasing pressure on legacy cryptography, blockchain networks are racing to harden their defenses with post-quantum cryptography. Most current blockchains derive their security from the fact that certain cryptographic puzzles cannot be solved quickly by a computer (such as elliptic-curve cryptography and RSA signatures).
While these methods are extremely secure against classical computers—requiring an estimated 1018 years to break with today’s computing power—they could theoretically be compromised in as little as hours with sufficiently powerful quantum hardware. In 2026, a growing number of new and legacy blockchains are actively focusing on quantum resistance.
Solana announced a collaboration with Project Eleven (a post-quantum security research group specializing in blockchain infrastructure) on Dec 16, 2025, to prepare the Solana ecosystem for the emerging threat of quantum computing. As part of this initiative, Project Eleven has developed post-quantum signature prototypes, conducted wallet-level risk analysis, and publicly demonstrated post-quantum transaction-signing environments compatible with Solana’s architecture.
Ethereum’s research roadmap also explicitly acknowledges the need for quantum resistance to preserve long-term network security. Current research efforts are centered on identifying replacements for cryptographic primitives such as BLS signatures, which play a critical role in Ethereum’s proof-of-stake architecture. Proposed alternatives include lattice-based signatures as well as hash-based or STARK-based verification systems. However, these approaches face practical challenges, including increased storage requirements and the need to maintain efficiency at network scale.
Soverium, a privacy blockchain featuring quantum-resistant cryptography, is the latest entrant, with its testnet set to launch Q1 2026 and mainnet Q4 2026, slated as the “new era of privacy.” It is an independent Layer 1 blockchain with full EVM compatibility and utilizes a Proof of Staked Authority consensus mechanism, enabling private transfers and zero-knowledge, post-quantum cryptography. By combining quantum technology with the booming privacy-token trend, Soverium highlights a new wave of more secure blockchain technology that will shape the next generation of blockchain releases.
In our view, the four-year cycle is no longer the primary framework for crypto in 2026. Instead, 2026 is likely to be shaped by a more structural set of drivers that have already changed the structure of this cycle: the direction of global liquidity and the Fed’s easing path, the scale and persistence of institutional demand via spot ETFs, balance-sheet accumulation from digital asset treasuries, and the regulatory backdrop.
BTC dominance has remained elevated, and any outperformance in altcoins has tended to be concentrated in select segments of the altcoin market — and not the broad-based “rising tide lifts all boats” altseason. The best example of that was the November-December 2024 post-election period where Layer 1 blockchains and DeFi protocols with strong ecosystems saw the bulk of the gains.
We project that 2026 will see a continuation of that K-shaped recovery for altcoins.
That is, next year we will see a further flight to fundamental value: altcoins with their own regulatory wrapper and those with innovative ecosystems that stand to gain the most from continued regulatory friendliness are likely to see inflows, creating a further bifurcated market.
These factors will likely also impact market depth: if the demand continues to be challenged mainly through regulated vehicles, the upside in 2026 is more likely to be concentrated in BTC and ETH, and only extend to selective large-cap altcoins where the ETF participation is available.
At the same time, an inflow of institutional capital does not remove downside risk – it reshapes it. Baseline volatility may be structurally lower as stickier holders and systematic options activity grow, but sharp drawdowns can still occur when leverage is forced out or when macro conditions deteriorate. If these drivers evolve favourably, 2026 can look less like the scheduled market crash as per the four-year cycle, and more like a continuation of a macro-driven market.
Our view that crypto will not necessarily be driven by the four-year cycle is clearly out of consensus when compared against options and prediction markets.
The options market implies just a 10.3% probability of BTC trading above what would be an all-time high price of $150K by the end of 2026.
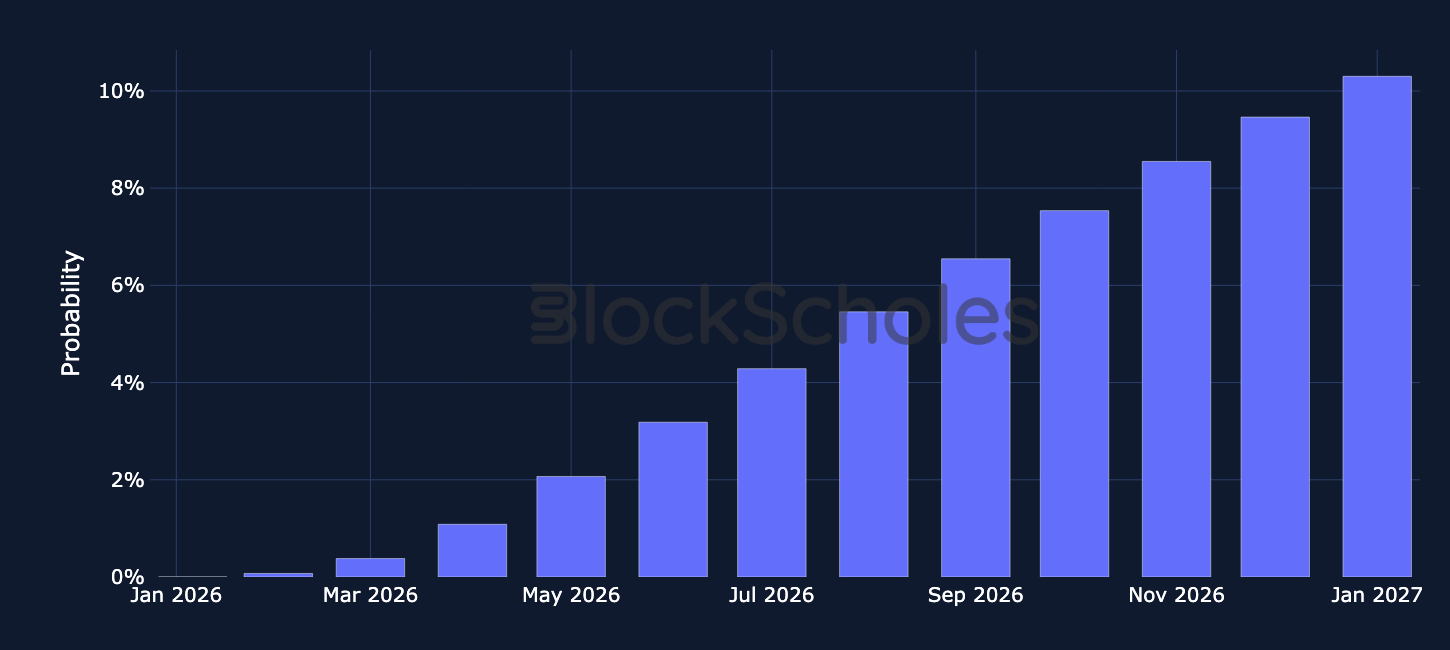
Polymarket odds that BTC will trade above $150K at any time in 2026 are higher, at 22%.

However, we believe that probability is too low.
The switch to ETF- and DAT-driven price action, assuming the Strategy-led model remains intact post-MSCI’s decision, has caused crypto-assets to pivot from being driven largely by supply-side dynamics (via the halving of the bitcoin block reward every four years). Instead, crypto price action has pivoted towards being driven by macroeconomic demand-side factors (such as global liquidity trends and risk-appetite).
Given that we see a potentially supportive macroeconomic environment for risk-on assets, and a continued supportive regulatory environment for crypto specifically.
We assign a higher chance of a new all-time high around $150,000 in 2026 than that which is implied by markets.

.jpg)


.jpg)


.jpeg)


.jpg)


.jpg)
