Thahbib Rahman
Research Analyst
Risk appetite has deteriorated sharply over the last week, with nearly $500B wiped from total crypto market cap since late January, with BTC’s 40% drawdown from the $126K peak accompanied by a fall in perp open interest from ~$5B to ~$3.6B. The move has triggered the largest level of liquidations across crypto markets since the Oct 10, 2025 crash and sees BTC trade below the average purchase level across all spot ETF holders for the first time since before President Trump’s reelection.

Risk appetite has deteriorated sharply over the last week, with nearly $500B wiped from total crypto market cap since late January, with BTC’s 40% drawdown from the $126K peak accompanied by a fall in perp open interest from ~$5B to ~$3.6B. The move has triggered the largest level of liquidations across crypto markets since the Oct 10, 2025 crash and sees BTC trade below the average purchase level across all spot ETF holders for the first time since before President Trump’s reelection.
However, derivatives market positioning is surprising: while demand for short-dated options has spiked higher, the volatility implied by options prices is still lower than the level of volatility that spot prices have moved with over the last seven days. In addition, the premium assigned to out-the-money protective puts is higher, but not as high as in previous extreme sell-offs.
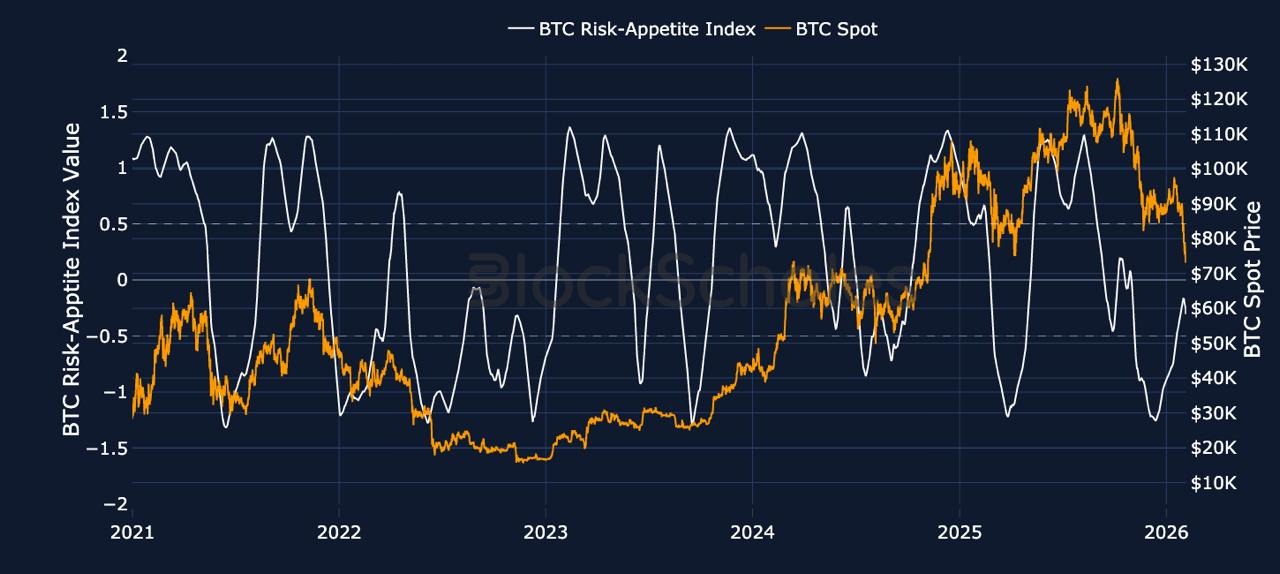
Nearly $500B from crypto’s total market-capitalization has been wiped out since late January 2026, following last weekend’s selloff. BTC fell to an intraday low just shy of $70K, down more than 40% from its all-time high and back to levels during November 2024's re-election of President Trump.
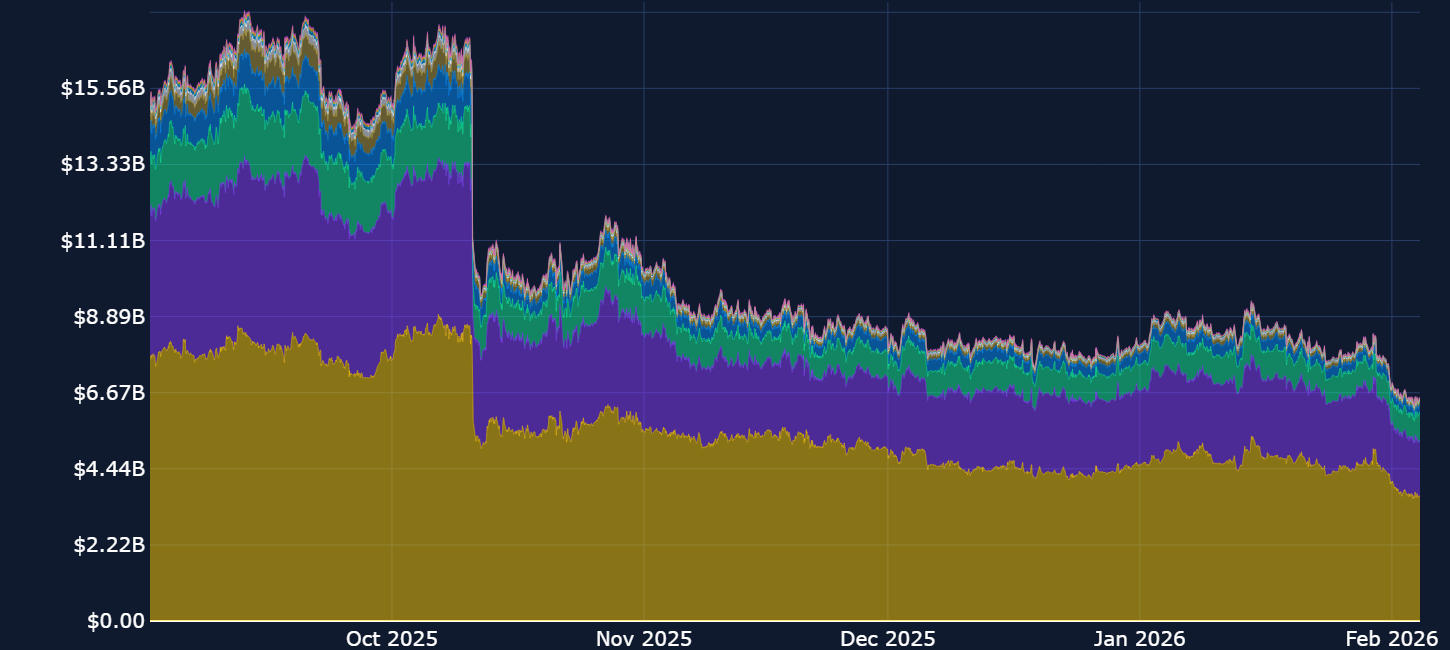
In fact, last weekend’s plunge in spot prices has resulted in the highest level of liquidations since October 10, 2025 - with open interest in BTC-denominated perpetual futures contracts falling from $5B down to $3.6B.
Does that mean crypto is in a full fledged ‘Crypto Winter’ bear market?
While a 40% drawdown from $126K is undoubtedly a significant move, there are parallels between now and the mid-cycle correction in 2021 which too saw BTC fall 40% from the then-ATH before recording a second peak in November of the same year.
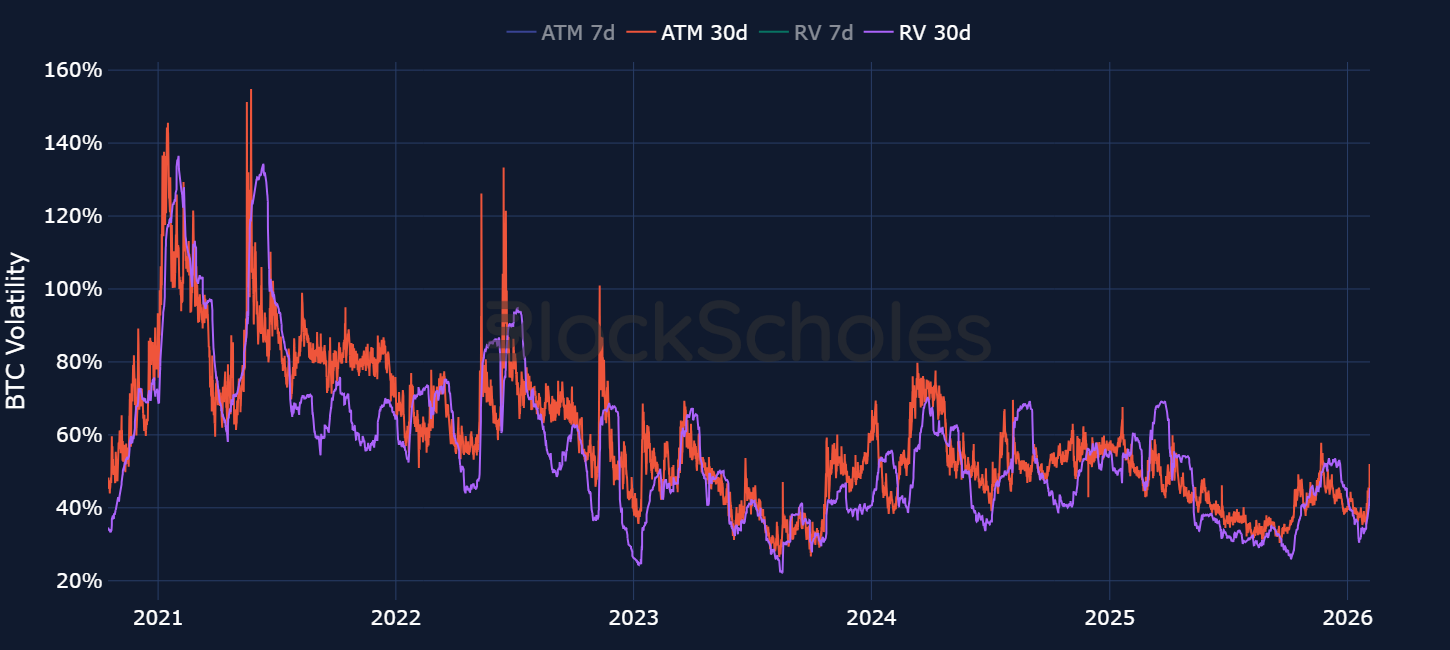
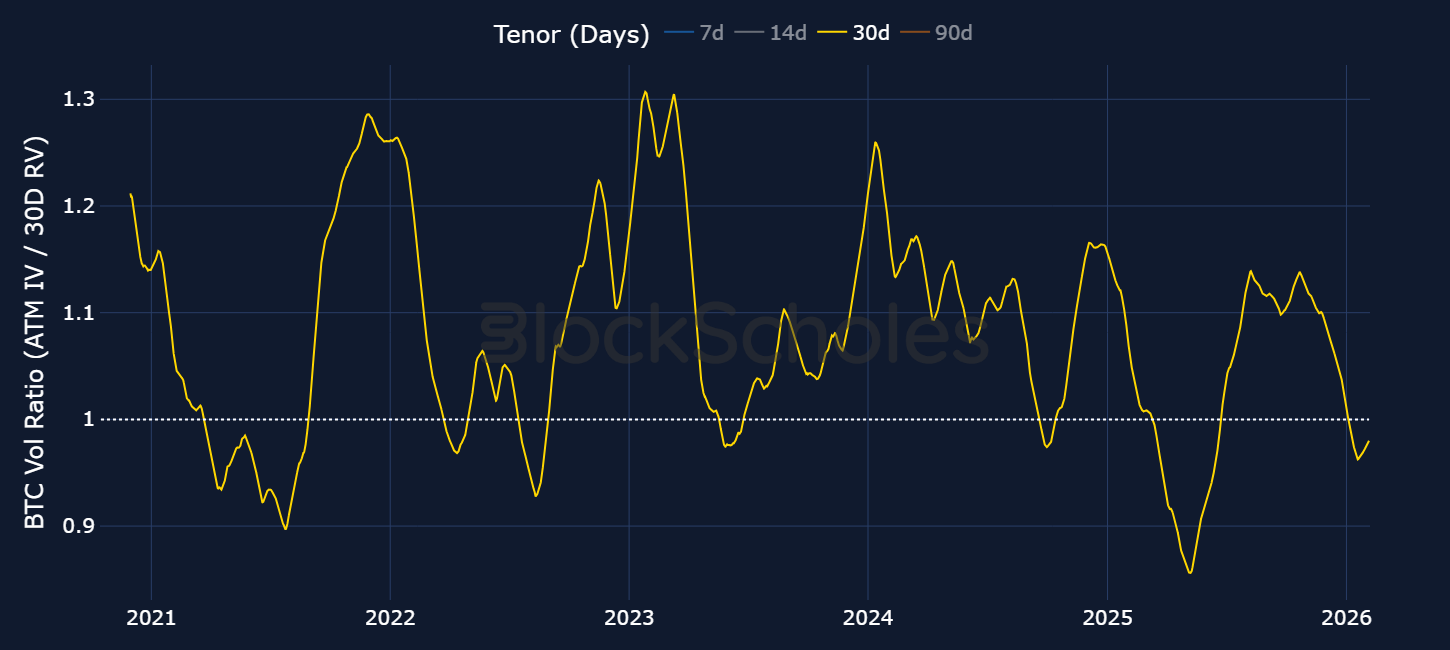
Not only is implied volatility closer to 50% for short-to-mid-dated options this time around, the ratio of BTC ATM implied volatility to realized volatility also indicated that options markets have priced in lower forward looking volatility expectations than the volatility that has been recently delivered (a ratio below 1). Compare that to 2022 for example during the FTX crash when implied volatility averaged 1.3x that which was delivered by spot prices.
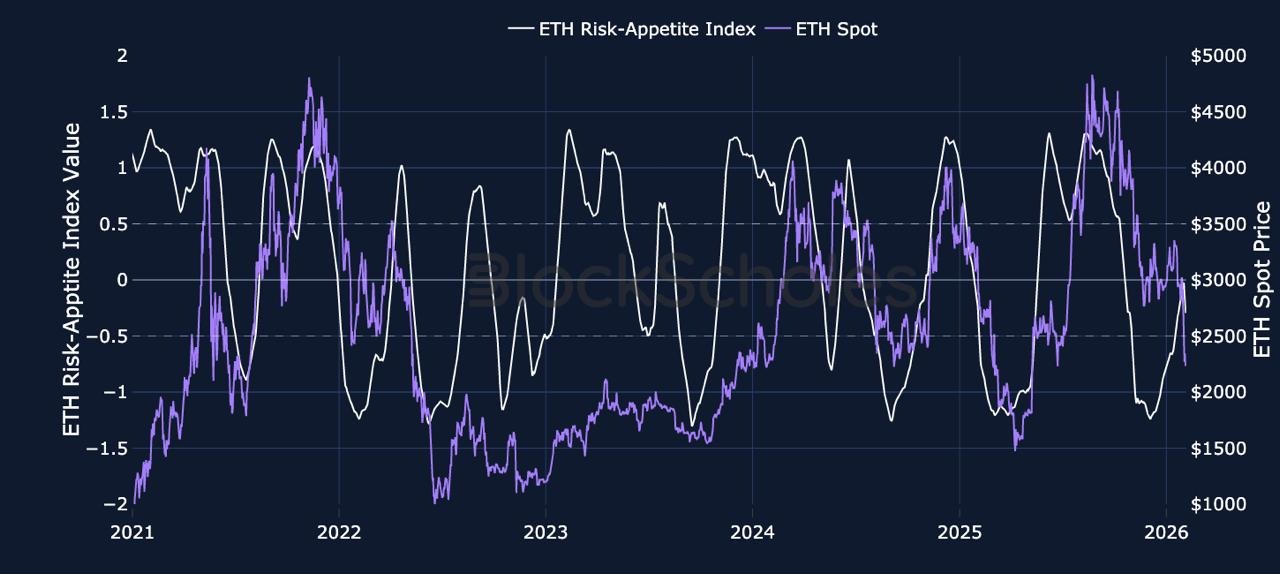
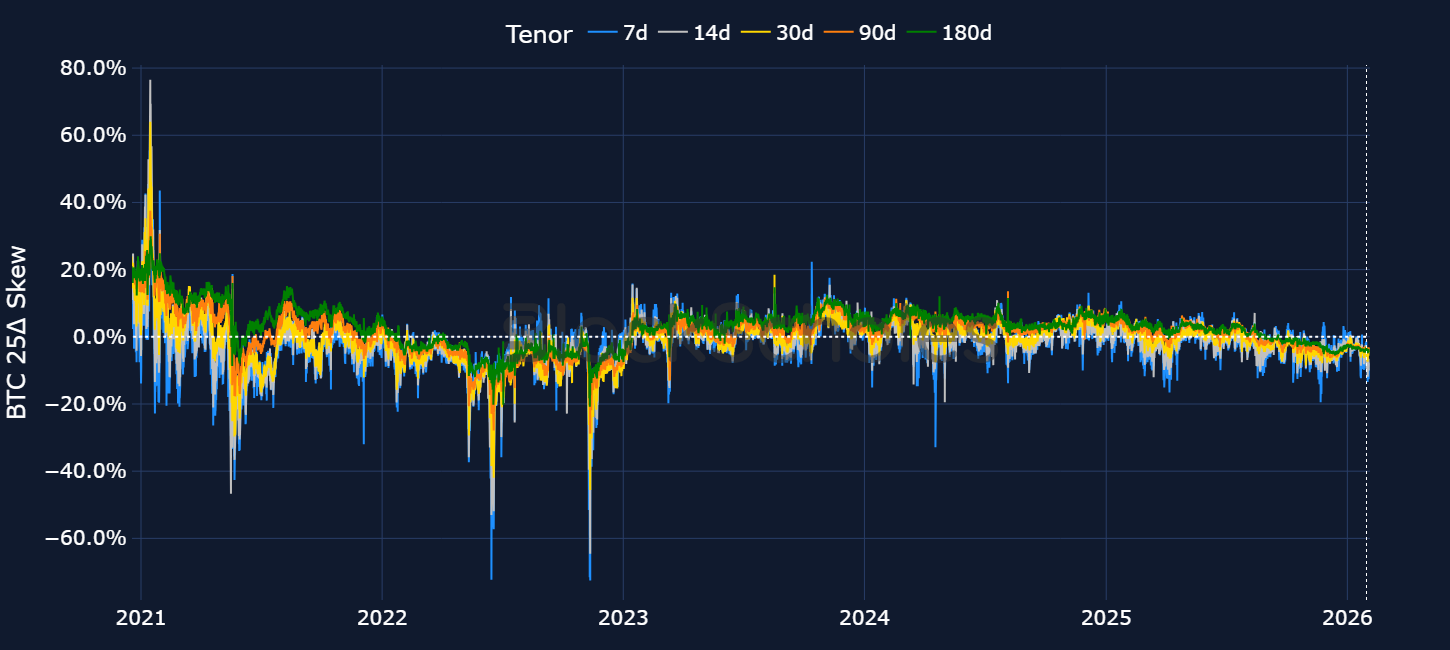
Another way to compare the demand for downside protection and the market’s expectation of further selloffs is through the 25-delta put-call skew ratio. While BTC and ETH volatility smiles currently assign a 15 vol point and 18 vol point premium towards put options, we are far below the extremes seen in 2022, when put contracts traded with a premium of more than 60%. Instead, current levels of premiums in put options relative to calls are closer to the mid-cycle correction in 2021, when put-call skew was between -10% and -15% for BTC.
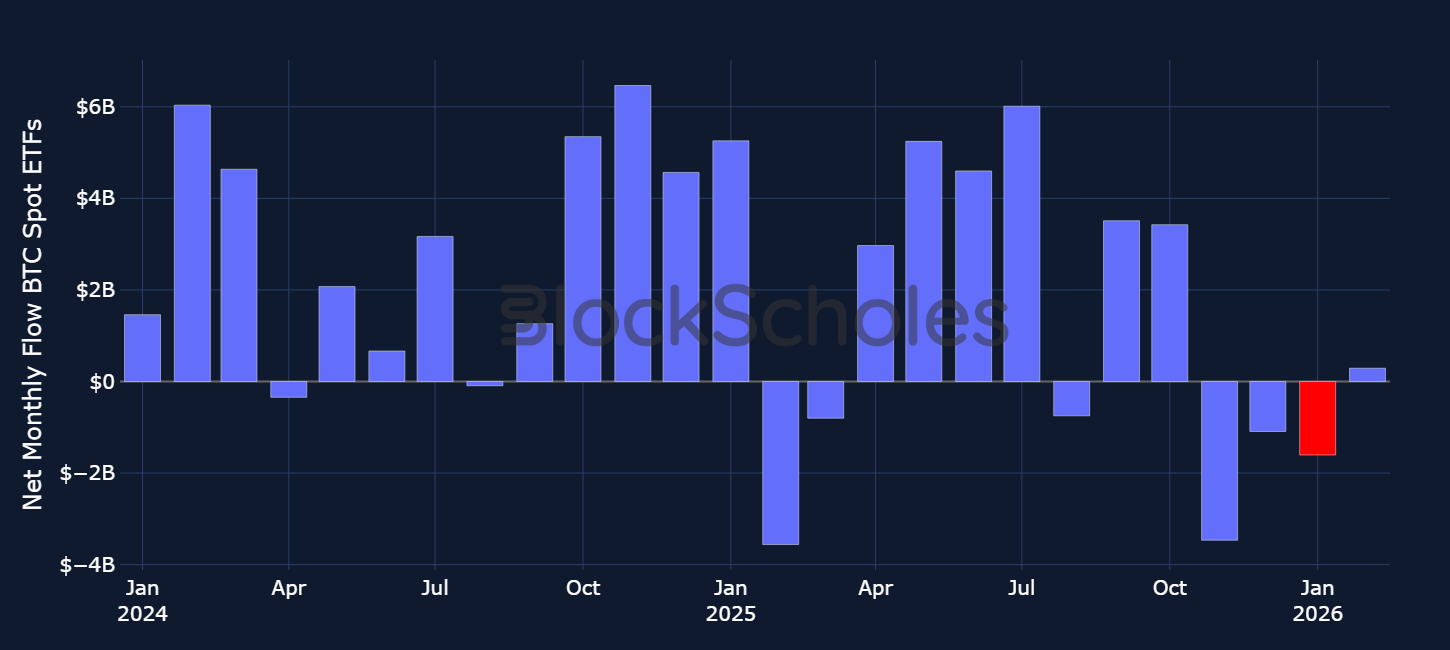
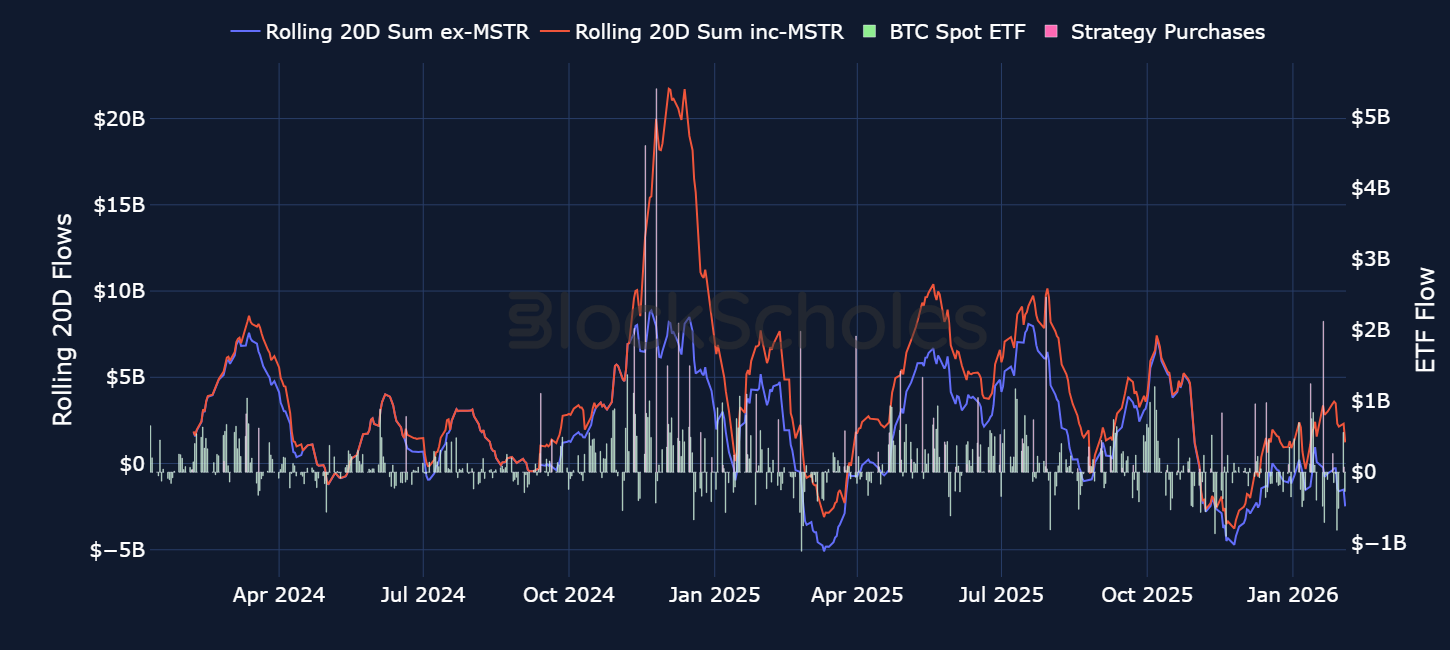
In 2025, spot price rallies in both BTC and ETH were consistently supported by strong streaks of positive inflows into Spot Bitcoin and Spot Ethereum exchange-traded funds. It is perhaps unsurprising therefore, that the declines in spot prices post October 10, 2025 have coincided with mostly an exodus away from Spot ETF products. The first month of 2026 saw BTC Spot ETFs sell $1.6B worth of bitcoins, registering their third-worst month since launch in January 2024 – with only February and November 2025 seeing more outflows.
For Bitcoin Spot ETFs in particular, we find evidence that Digital Asset Treasuries (DATs) – specifically, Michael Saylor’s Strategy – are the main institutional buyers to have supported demand. The 20-day rolling sum of flows into Spot Bitcoin ETFs has been negative for most of Q4 2025 and into the new year, while the rolling 20-day sum when we include Saylor’s Bitcoin purchases is close to $1.5B.
With BTC trading in the lower-$70K region, the average Spot ETF buyer is currently underwater, given that the average purchase price of one bitcoin amongst Spot ETF holders is $84K (a current loss of -11%). The last time BTC traded below the cost basis was back in September 2024.
The story is more bearish when it comes to institutional demand for Ethereum. January marked the third month in a row where Spot ETFs net sold Ether, with signs of slowdown in buying from ETH’s largest DAT by supply-held (BitMine Immersion Technologies).
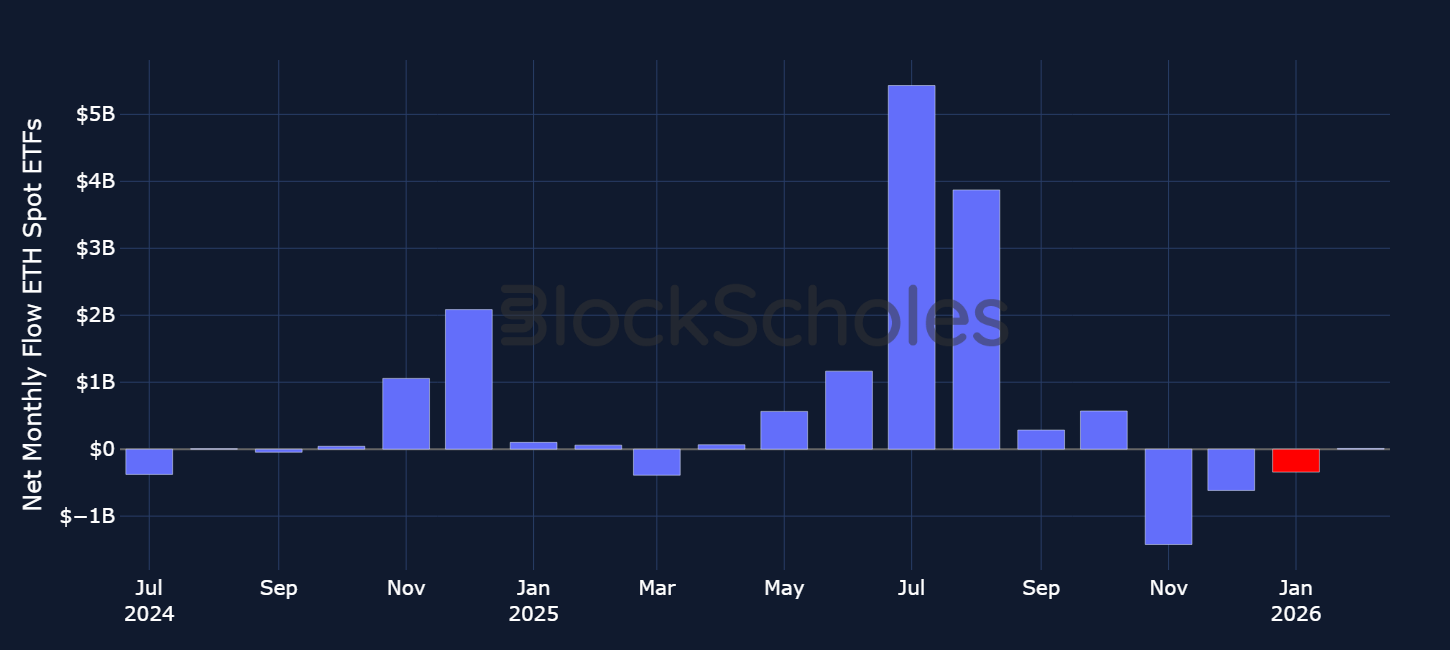
Despite the firm announcing that it had acquired 41,788 ETH over the past week, there are signs that the scale of its ETH purchases are slowing down, even in spite of ETH’s falling price.
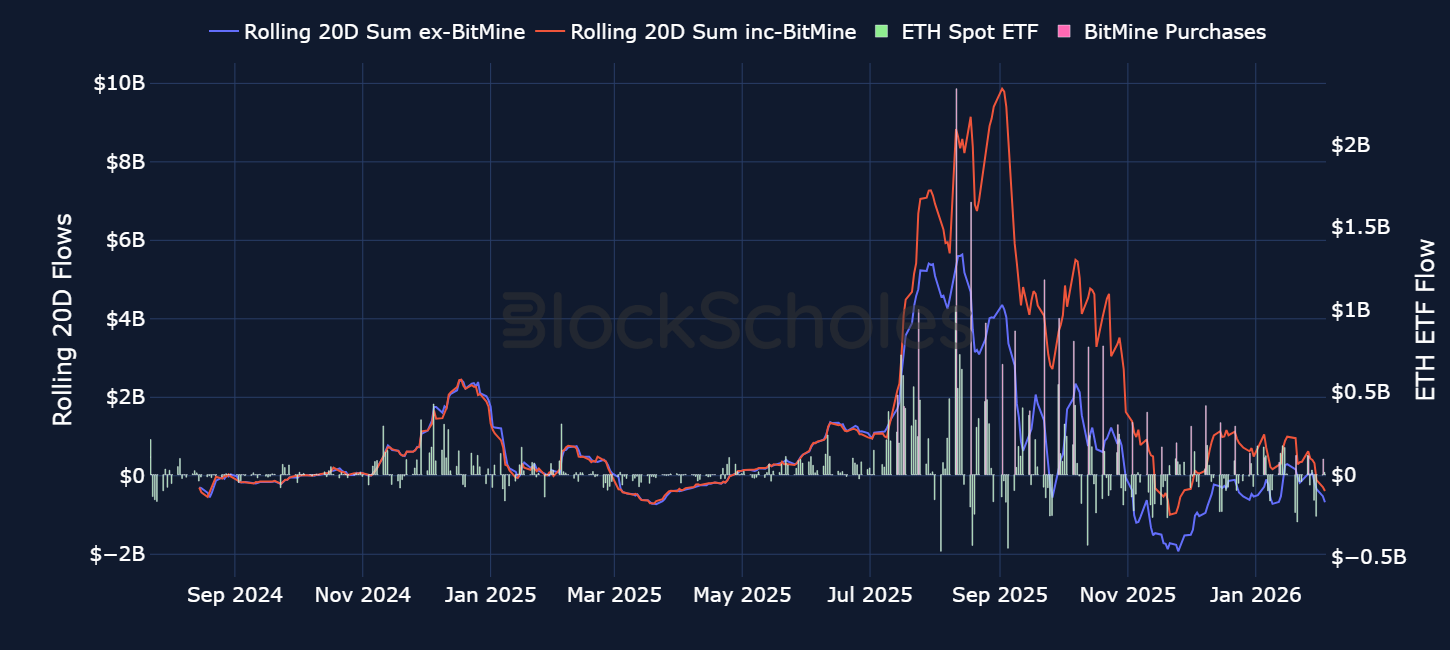
Nonetheless, Chairman Tom Lee recently justified its purchases stating that “we view this pullback as attractive, given the strengthening fundamentals. In our view, the price of ETH is not reflective of the high utility of ETH and its role as the future of finance.” Lee also defended the firm’s $6B in paper losses, stating that the losses are “not a bug”, but “a feature” of an ETH-based DAT.
Plotting the same 20-day sum of ETF flows and flows including BitMine purchases, it is clear that momentum both from ETF buyers and BitMine is waning.
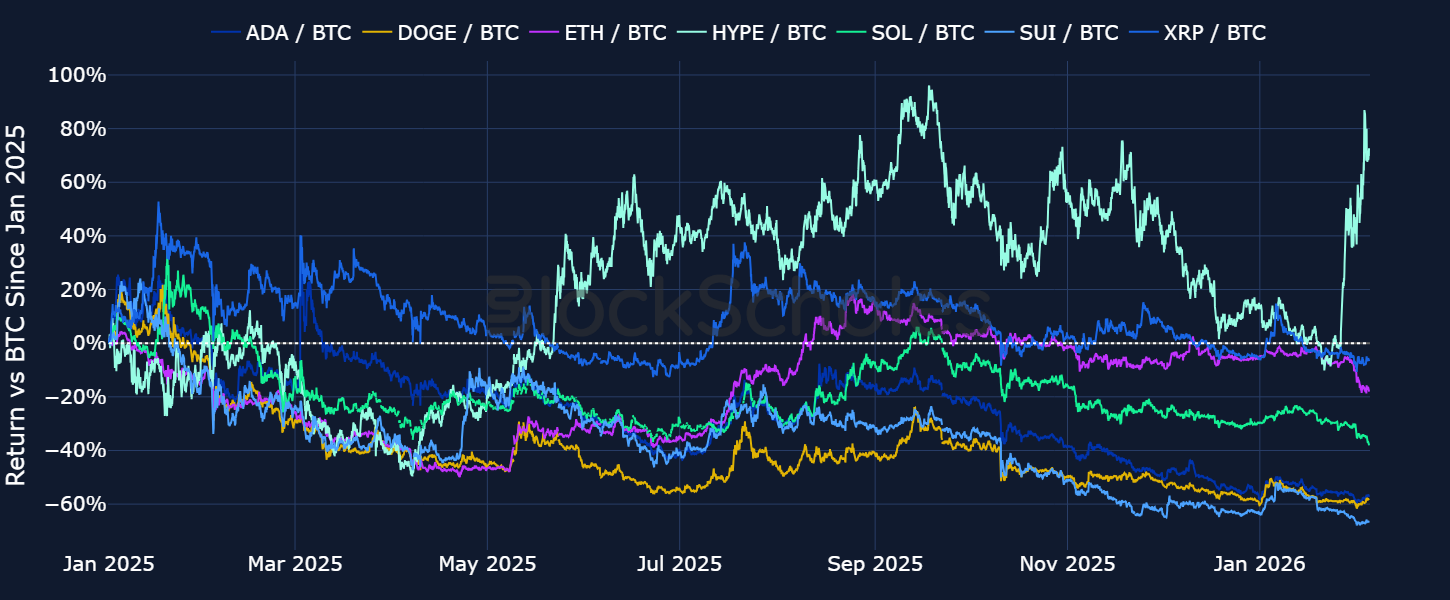
Despite a market-wide de-risking, one asset stands out for its continued outperformance: Hyperliquid’s native HYPE token.
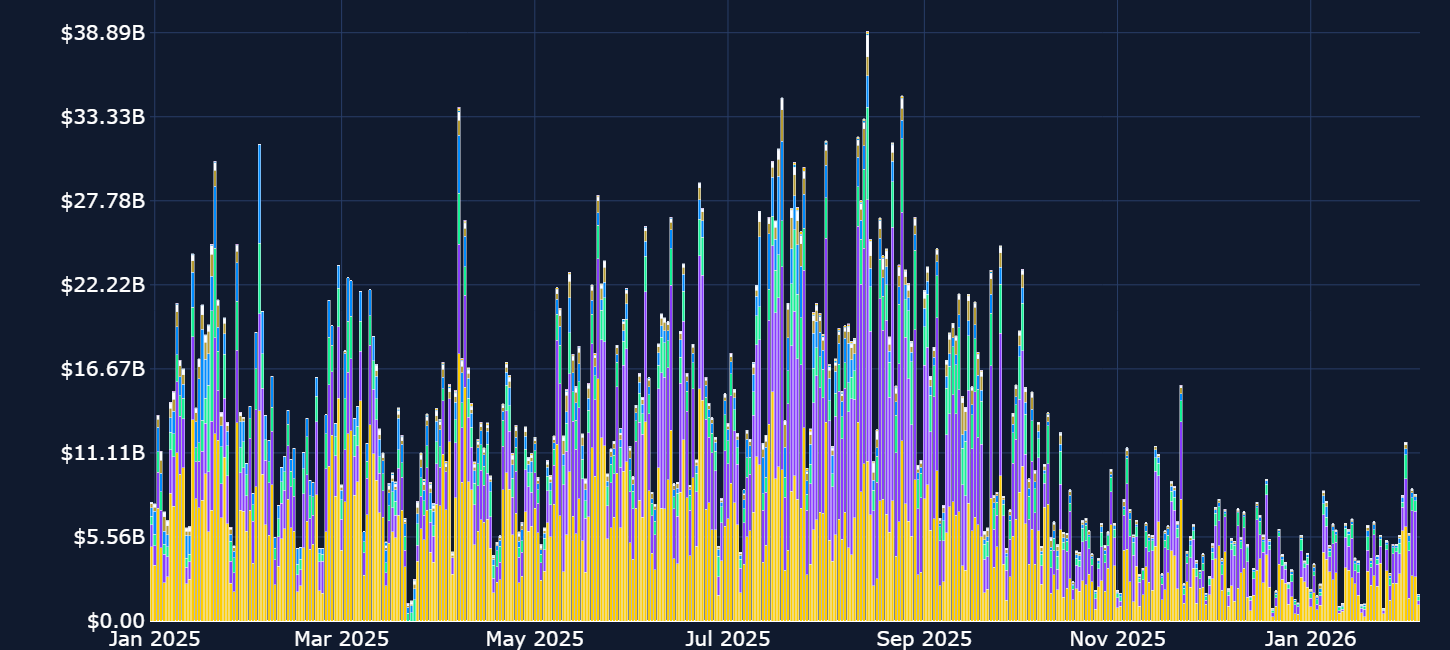
Trading volumes on Hyperliquid have recently exceeded $10B per day, driven by a surge in RWA-perp related trading. Over the past two weeks, daily 24-hour volume on Hyperliquid’s Silver perp contracts has repeatedly exceeded $1.5B, driven by first the rally and then subsequent correction in precious metal prices. Given Hyperliquid’s aggressive buyback program (which allocates 97% of the protocol’s revenue towards token buybacks), HYPE’s 30% rally over the past 30 days is perhaps somewhat unsurprising.
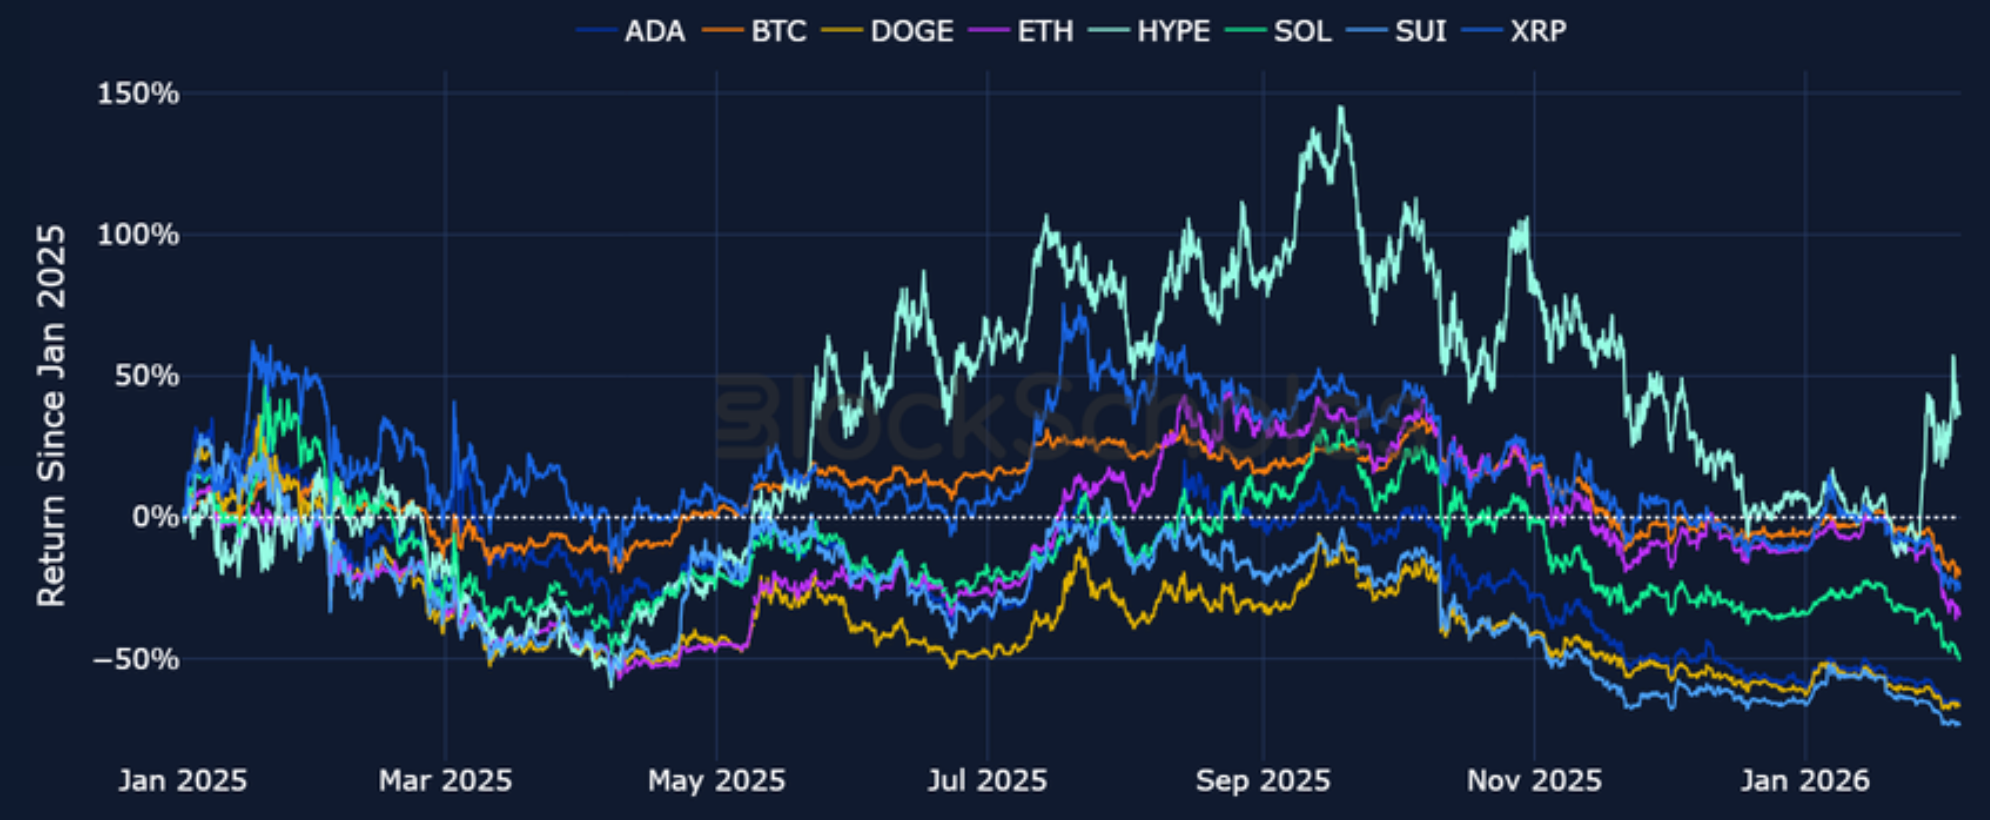
Not only is HYPE the only blue-chip crypto token that is trading above its 2025 levels, its outperformance over the rest of the market when benchmarked against BTC stands out too. Over the past month in particular, HYPE/ BTC is up close to 80% and HYPE is also the only altcoin so far this year to have a positive year-to-date return.
While the platform’s main focus has been on perpetual swap contracts that provide linear, leveraged exposure to an underlying asset, the protocol recently confirmed the announcement of HIP-4: Hyperliquid Improvement Proposal-4, which will introduce permissionless “Event Futures” on the platform – binary options contracts where users bet on the probability of an event occurring; similar to markets that currently exist on Polymarket.
Since the September 2022 Merge shifted Ethereum from Proof-of-Work to Proof-of-Stake, Ethereum’s development has been delivered through periodic network upgrades (implemented via Ethereum Improvement Proposals - EIPs) and that have increasingly focused on scaling. In practice, much of that scaling effort has targeted making it cheaper for Layer-2 (L2s) rollups, including cheaper blockspace for L2s and rollups by introducing a completely separate market to pay for gas, called “blob gas to facilitate third-party L2s to taking on the mantle of scaling Ethereum as the “branded shards”.
As the chart below shows, L2s took on this task, and subsequent upgrades have repeatedly expanded the blob space devoted to them.
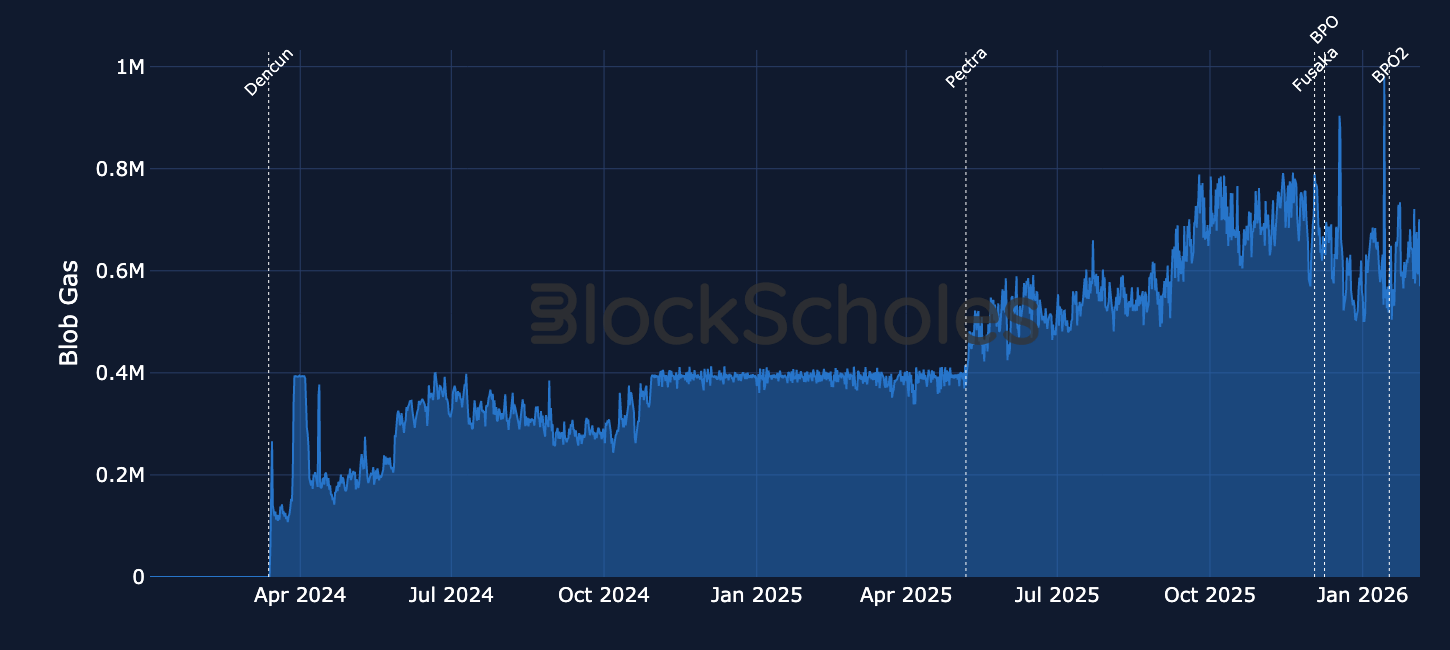
However, Ethereum founder Vitalik Buterin argued in an X post on Feb 3, 2026 that the original “branded shards” plan no longer makes sense because “two facts” have emerged in parallel:
Together, they mean “the original vision of L2s and their role in Ethereum no longer makes sense, and we need a new path.”
The implication is that L2s cannot rely on the assumption that they add value primarily by scaling Ethereum. Instead, he suggests L2s and rollups should distinguish themselves through clearer product trade-offs, including cases where “customers’ regulatory needs require them to have ultimate control”. However, price action in ETH and L2 governance tokens shows little reaction beyond the general underperformance of altcoins so far.
1) Hyperliquid unveiled HIP-4, a proposal to add general-purpose “outcome trading” to its platform.
The upgrade introduces a new class of fully collateralised outcome contracts, which have dated expiries with non-linear payoffs using fully-collateralised event markets.
Outcome trading will debut on testnet, initially with a tailored set of markets, before potentially moving to permissionless listings if user feedback is positive.
The feature will settle in Hyperliquid’s USDH stablecoin and run on HyperCore, the exchange’s high-performance execution engine.
2) Jupiter, Solana’s largest decentralised exchange (DEX) aggregator, is bringing Polymarket to the network via a new in-app integration that embeds prediction markets directly into its trading interface.
In a post on X on Feb 1, Jupiter said it has launched a built-in “Prediction” feature, allowing users to trade Polymarket contracts without leaving the Jupiter app.
“Integrating Polymarket is primed for making Jupiter the most innovative predictions platform on Solana,” the exchange said, positioning Jupiter as a hub for prediction markets on Solana by combining its existing trading interface with Polymarket’s event-based markets, which are now accessible directly within the Jupiter app.
3) Aave Labs is scrapping the Avara umbrella and shutting down the Family wallet as it narrows its focus back to its core DeFi business.
Side projects that sat under Avara, including Lens, are now being set aside and not being treated as part of its core business, with future products and apps returning to the Aave Labs name.
Nietzschean Penguin (PENGUIN) is a Solana-based SPL token that is positioned principally as a community- and culture-led digital asset. The project’s published materials indicate that it is driven by community participation and narrative momentum, and explicitly notes the absence of both a formal roadmap and any guaranteed utility. The principal drivers of market participation are expected to be community engagement, narrative traction and liquidity conditions, as opposed to observable progress in product feature delivery or protocol upgrades.
As a standard Solana SPL asset, PENGUIN benefits from high-throughput settlement and comparatively low transaction costs, with issuance and transfers handled through Solana’s native token programme rather than bespoke smart-contract logic. Trading activity is therefore expressed primarily through venue liquidity: on-chain via Solana-based liquidity pools and off-chain via centralised exchange order books, where pairs are commonly quoted against USDT.
Bybit has a new spot trading pair PENGUIN/USDT, listed on Jan 31, 2026
Open interest and trading volume data are sourced “as is” from the Bybit exchange platform API exclusively, and as such do not represent a comprehensive picture of the sum of trading activity across all derivatives markets or exchanges. The data visualized in this report consists of hourly and daily snapshots, recorded over the previous 30 days. Daily (hourly) snapshots of trade volume record the total sum of the notional value of trades recorded in the 24H (1 hour) period, beginning with the snapshot timestamp.
If not explicitly labeled as derived from another exchange, the input instrument prices to all derivatives analytics metrics in this report are sourced from the appropriate endpoints of Bybit’s public exchange platform API. In the event that data is labeled or referred to as representing the market on another exchange source, that data is sourced from the appropriate endpoint of each respective exchange’s public API.
Macroeconomic charts and data are sourced “as is” from the Bloomberg Terminal. Exchange data is sourced “as is” from publicly available exchange APIs. Block Scholes makes no claims about the veracity of public third-party data.
After acquisition of underlying-denominated raw data for open interest and trading volume on the Bybit exchange platform from Bybit’s API endpoint, equivalent dollar-denominated figures are calculated using the concurrent value of Block Scholes’s Spot Index for the relevant underlying asset.
Block Scholes’s Spot Index represents the aggregate Spot mid-price for a given currency across the top five CEXs by volume (with USD-quoted markets). It considers the proportion of total volume in the instrument on the exchange, as well as the deviation of a data point from those on other exchanges.
Futures prices are used for Block Scholes’s futures-implied yields calculation services in order to derive the constant-tenor annualized yields displayed in the Futures section of this report.
Options prices are used for Block Scholes’s implied volatility calculation services in order to calibrate volatility surfaces, from which all derivatives volatility analytics displayed in the BTC Options and ETH Options sections of this report are calculated. Volatility smiles are constructed by calibrating to mid-market prices observed in Bybit options markets. As part of the calibration process, prices go through rigorous filtration and cleaning steps, which ensures that the resulting volatility surface is arbitrage-free and has exceptional fit to the market observables.

.jpg)


.jpg)


.jpeg)


.jpg)


.jpg)
