Andrew Melville
Research Analyst
While a large portion of the past two crypto bull runs (2015-18 and 2019-22) was dominated by Bitcoin outperformance, that did not last forever – both cycles eventually experienced a period of vicious capital rotation out of BTC and into altcoins. This eventually heated up into what is referred to in crypto folklore as ‘Altseason’: a time of significant and sustained outperformance of altcoins relative to Bitcoin. Ethereum, the second-largest cryptocurrency by market capitalization, has long stood as the bellwether for the wider altcoin market and, in extension, with altseason.

While a large portion of the past two crypto bull runs (2015-18 and 2019-22) was dominated by Bitcoin outperformance, that did not last forever – both cycles eventually experienced a period of vicious capital rotation out of BTC and into altcoins. This eventually heated up into what is referred to in crypto folklore as ‘Altseason’: a time of significant and sustained outperformance of altcoins relative to Bitcoin. Ethereum, the second-largest cryptocurrency by market capitalization, has long stood as the bellwether for the wider altcoin market and, in extension, with altseason.
That’s because Ethereum has historically been the first beneficiary of the capital rotation out of Bitcoin. However, one of the points we highlighted in our previous ‘The Altcoin Rotation: Why and When Altcoins Outperform Bitcoin’ report, is that the 2022-to-present crypto cycle has been unique not just due to its failure to exhibit the typical rotation of capital out from BTC and into ETH, but also because we are yet to see a sustained period of significant outperformance from Ethereum.
To put those periods of outperformance in context, between January 2017 and January 2018, ETH rallied from $8 to a peak of $1,448 and, in January 2021, surged from $738 to a peak of $4,800 by November 2021.

Therefore, Ethereum’s most recent rally (beginning on May 7, 2025), has caught the attention of many market observers. Why did ETH rally close to 50% in a single week and outperform the rest of the top 10 tokens by market cap? Will ETH’s rally continue? Is the rally really a prelude to an altcoin season? In this report, we aim to understand where exactly we are in the current crypto cycle and contextualize Ethereum’s most recent rally relative to historical price action.
First, the question on everybody’s mind – are we in an altseason?
To answer this, it is worth taking a step back. Crypto cycles have historically been cyclical in nature. Each cycle began with BTC reclaiming the all-time high (ATH) of the previous cycle, followed by a period of euphoria and BTC price discovery, and finally a major crash of up to 80% before the cycle starts anew. In the second phase, we have historically seen BTC take to the sidelines as a rotation of capital occurs from BTC into ETH and other large-cap tokens. That later eventually trickles down into smaller market-cap and riskier tokens, such as memecoins. That has, based on the past two cycles, occurred around 200 days following the Bitcoin halving on average.
In early May this year, we saw some initial signs of that euphoria stage, albeit more than 100 days later than the average. In a similar vein to 2017 and 2021, ETH began to rally alongside BTC before quickly outperforming it. When plotting ETH’s market-cap relative to the total crypto market-cap in each cycle (excluding 2012) before and after the Bitcoin halving date, we find that in the past two cycles, ETH’s relative market-cap surged 10-30 percentage points during altseason, coinciding with continued rallies in ETH’s spot price.
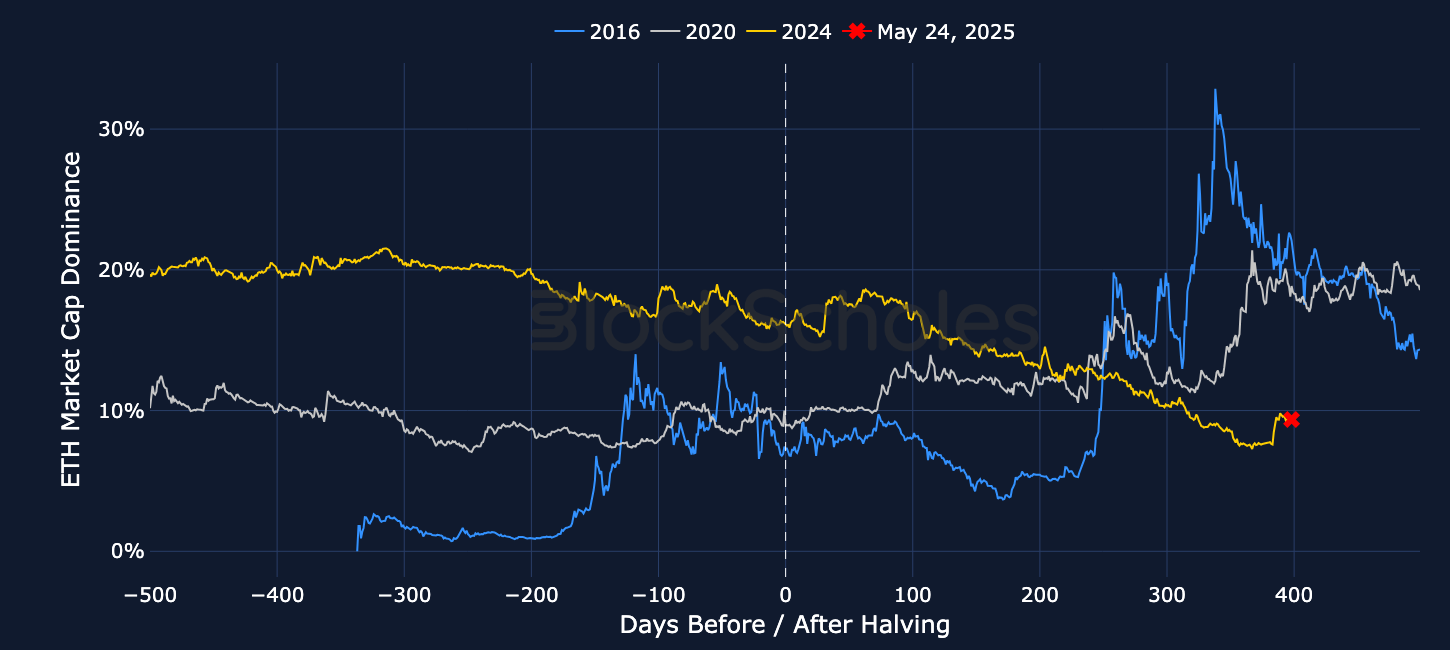
However, even the most recent increase in ETH’s market-cap dominance has not yet reached the same heights that characterized the previous two cycles. That makes sense – despite the 60% increase in ETH spot price over the past month, it is still close to 50% below its 2021 all-time high, a stark contrast to the previous two cases where ETH was continuously reaching new local highs.
ETH’s share of total market capitalization has actually been on a steady decline since its 2017 highs, even as the broader crypto market cap expanded. Currently, ETH makes up 9% of the total share of crypto market capitalization – while not the lowest value historically, this shows evidence that ETH’s proportion of the market is still subdued despite such a strong increase in its spot price. It also reinforces the notion that ETH’s recent rally, although impressive in isolation, has not translated into the 20-30% dominance the second-largest cryptocurrency once controlled.

The increase in ETH dominance does, however, coincide with only the second decline in BTC dominance of more than 5% since the April 2024 BTC halving. That first drop in dominance was during the post-US election period in November 2024 (around the 200 day mark). Bitcoin broke the highly coveted $100K for the first time, and was outperformed by a slew of Layer-1 and Layer-2 blockchains. At first glance, this was the moment altcoins had reached the escape velocity they require for altseason. However, the majority of that dominance decline was attributed to the resurgence of XRP, which ate away capital from the rest of the altcoin market.

Unfortunately, however, that drop in dominance from 61.0% to a low of 53.8% was not of the same size as the collapses we would attribute an altcoin season to – nor is May’s drop from 66.9% to a low of 62.8% reminiscent of previous altcoin seasons either. Those cases saw BTC dominance completely crater by 30-50 points, far higher than the 5 and 7.2 percentage points we saw in May 2025 and November 2024, respectively.
However, all hope for an altseason is not yet completely lost simply because ETH’s recent rally was unable to meaningfully break down BTC dominance. That’s because, as we have seen in previous cases, there is evidence that the rotation of capital did not just stop at Ethereum. In fact, despite its sharp and sudden rally, ETH has actually been outperformed by three of the top 10 Layer-1 blockchains by market cap since President Trump’s so-called ‘Liberation Day’ on Apr 2: Hyperliquid’s HYPE token, Sui blockchain’s SUI token, and Solana’s SOL token.
The latter two tokens in particular have often been dubbed ‘Ethereum Killers’ – their rally alongside and beyond the increase in ETH, suggests that utility blockchains and large-cap tokens also benefited from the broader market momentum – and that the recent rally was not just a case of Ethereum and everything else.

It doesn’t just stop at utility tokens either. As with all asset classes, but perhaps more so with cryptocurrencies, traders quickly move along the risk curve, increasing their exposure to risk by rotating their capital into lower-cap tokens or, often, memecoins.

We see that in the chart above, which plots the returns since May 7, 2025 (the day of the Pectra upgrade) of the top 10 largest memecoins on the Ethereum network by market capitalization. Many of those memecoins are high-beta assets to ETH, providing amplified returns on top of those traders can get from simply having exposure to ETH via their high levels of correlation.
Take the example of SPX6900, a play on the TradFi S&P 500 index; its returns have exhibited a beta of 2.1 relative to ETH’s returns since September 2023, indicating that for every 1% move in ETH, SPX6900 has historically moved 2.1% on average, amplifying ETH’s price action more than twofold. Neiro, one of the largest dog-based tokens on Ethereum, surged over 200% in the 6 days after ETH began to rally – a fourfold increase to that of ETH over the same period.

Zooming out, however, memecoins on Ethereum (and in general, across blockchains) are still down significantly from their post-election highs. Excluding PEPE, perhaps the most well-known ETH memecoin in the list, the rest of the tokens (including ETH) are down as much as 60% since President Trump’s election victory. These memecoins do not just act as beta plays on ETH on the way up only – during risk-off environments, they often record larger drawdowns. However, this also suggests that the recent rally has not yet culminated into the altseason period as we know it – the tokens on the far end of the risk curve still have a lot of catching up to do, and markets are yet to have reached the same level of froth that altseason typically brings.
If we aren’t quite in an altseason just yet, how can we describe Ethereum’s most recent rally?
Many have attributed it to the most recent Pectra upgrade rolled out on the Ethereum mainnet on May 7, 2025. Pectra is the most recent of a series of upgrades to the Ethereum network, advancing Ethereum’s roadmap for scaling its transaction throughput and maintaining its competitiveness against emerging Layer-1 blockchains.
Indeed, an initial glance would attribute ETH’s rally to the Pectra upgrade. The following chart plots ETH’s spot price ahead of and following the Merge in September 2022 (blue), Shapella in April 2023 (grey), Dencun in March 2024 (yellow), and finally Pectra (green) in May 2025. The Merge and Dencun ultimately culminated in a “sell-the-news” event, but Pectra and Shapella were followed by spot price rallies.

What makes Pectra unique, however, is that not only did ETH rally stronger than it had done so following all of the aforementioned upgrades, but also because no upgrade had come after such a negative run in spot price. If the Pectra upgrade had a point to prove for the Ethereum network – at first glance, it certainly appeared to have done so.

However, options markets tell a very different story – one that makes it difficult to solely attribute the reaction to Pectra. Options prices reflect the volatility that market participants expect spot price to move with over some period of time in the future. The term structure of volatility is an extension to that – showing the volatility implied by the price of options (struck at-the-money) over a number of different periods into the future.
The chart below plots the implied volatility of ETH at-the-money options across several constant tenors through April and early May. The Ethereum Foundation first announced on Apr 23, 2025 that Pectra was planned to be rolled out two weeks later on May 7, 2025. If traders were to price in some level of uncertainty about the outcome of Pectra, we would have expected to see it in the volatility expectations for short-term tenors, most notably the 14-day tenor.

At first glance we see that ETH’s term structure of volatility had inverted, with the 7- and 14-day volatility surging. However, that positioning was more a reaction to changes in the macro environment than positioning in preparation for the Pectra upgrade. We saw front-end volatility for BTC also jump up at the same time – while its term structure did not invert like ETH’s, BTC had no planned upgrade in the foreseeable future for its own implied volatility to increase at the front end.
Pectra is also the only upgrade to the Ethereum network that caused at-the-money implied volatility to rise following the upgrade. This posits further evidence that, had markets priced in a significant risk premium ahead of Pectra, we should have expected that volatility premium to collapse after the rollout of the upgrade as the uncertainty passed, not increase – that’s something we not only saw in previous upgrades, but also previous events where a big volatility premium had been baked in ahead of time, such as the presidential election back in November 2024.

The increase in the at-the-money implied volatility, particularly for short-tenor ETH options (7- and 14-day tenors) is more clearly seen in the chart below. In the buildup to Pectra we find volatility was relatively subdued – in fact, the lowest volatility expectations over the upcoming 7 days in the entire month of May came just before the rollout of the upgrade. It was only after the event that traders began to price in a significant volatility premium over the next week, and that resulted in an inverted term structure of volatility (where short-dated options trade with a higher volatility premium than longer-dated options).

Therefore, it becomes quite clear that the lack of a significant volatility premium in derivatives markets ahead of Pectra, and the subsequent increase in volatility expectations following the network upgrade, both suggest ETH’s rally cannot be solely attributed to Pectra.
While we don’t see it as a reaction to the successful completion of the Pectra upgrade, we don’t think that Ethereum’s rally from May 8, 2025 was purely down to chance. Not only was it the day after Pectra was successfully implemented on the Ethereum mainnet, it was also on the same day that President Trump announced his administration had reached its first trade deal with a major trading partner: the UK. Risk-on momentum engulfed US equity markets and the crypto market alike as the S&P 500, Nasdaq-100, BTC and ETH all began to rally simultaneously. Speaking at the White House on the same day, President Trump said “You better go out and buy stocks now. This is going to be numbers that nobody’s ever seen before”.
Trump also foreshadowed a decrease in a two-month tit-for-tat game of chicken with China, stating that “you can’t get any higher, it’s at 145%, so we know it’s coming down”. Those signs of easing trade tensions following an ignition of acute volatility in April were enough to at least partially flip macro sentiment – and the shift to risk-on behavior found Ethereum as its major beneficiary. On May 8, 2025, ETH rallied over 23%, marking its largest single-day gain since May 2021.

Less than a week later the US and China formally announced a reduced tariff rate for 90 days, with levies on Chinese goods falling to 30%. The US negotiating a trade deal with China, arguably the toughest negotiation on their docket, resulted in a sustained period of renewed optimism that both Wall Street and crypto markets were able to benefit from. During that period, we saw a material shift in sentiment in ETH’s derivatives markets.
Various major measures of directional sentiment surged amidst confirmation of the US-China ceasefire, despite its temporary nature. ETH’s 30-day futures implied yield exceeded 15%, indicating a willingness by ETH traders to pay a substantial premium above ETH’s spot price in order to gain long exposure. While that has since relented to (a still extremely elevated) 10%, note that futures yields did not price in such bullishness prior to May 7, i.e., in anticipation of the Pectra upgrade – instead their climb came in line with the rebound in risk appetite.

That same exuberance can be seen through positioning in perpetual swap funding rates. After fluctuating between positive and negative values through April and early May, the moderation in President Trump’s trade war ended the volatile whipsaw of funding rates. For most of the post-May 7 period, perpetual swap prices for ETH have traded above its spot price, a firm indication of traders willing to pay for leveraged long exposure in ETH.

The price behaviour of gold, a battle-tested safe haven, also helps to solidify that the rally in risk assets such as Bitcoin and Ethereum can be attributed to a relaxation in the tariff uncertainty that has upended markets since February 2025. After reaching numerous new all-time highs since January 2025, the economic fallout that many traders were expecting from Trump’s tariffs took a slight U-turn, and as such, gold prices began to drop off from their highs of $3,400 per oz. That semblance of calmness then opened the way for a basket of Trump Trades, such as SPX, NDX, BTC, and ETH to start moving higher.

Ethereum’s most recent rally has reignited debate about where we are in the broader crypto cycle and whether the conditions for a true altseason are finally beginning to materialize. While the rally coincided with the rollout of the Pectra upgrade, positioning in options markets suggests that macroeconomic forces – particularly the easing of trade tensions and subsequent shift in risk appetite – were the real catalysts. The lack of a significant volatility premium ahead of Pectra, followed by a sharp increase in implied volatility and directional positioning after the upgrade, suggests that the market had not anticipated the event as a primary cause for a rally.
Importantly, Ethereum’s outperformance also did not occur in isolation. Large-cap Layer-1 tokens such as SUI, HYPE, and SOL, each rallied (and in some cases even outperformed ETH’s 50% rally) as well as tokens further along the risk curve into Ethereum-based memecoins. The behavior of tokens like SPX6900 and PEPE may raise hopes of an altseason, but these flows have yet to translate or spark into the capital rotation and broad-based frenzy that defined prior altseasons. As such, Bitcoin dominance has dipped but not collapsed and (despite an increase in altcoin market caps) many remain far off their cycle highs – or in the case of Ethereum, previous cycle highs.

.jpg)


.jpg)


.jpeg)


.jpg)


.jpg)
