Andrew Melville
Research Analyst
The beginning of “Crypto Week” saw a number of positive developments for the crypto industry. As the week began, BTC surged to a new all-time high of $123K. However, as the week’s end approached, the spotlight switched toward altcoins, which rallied significantly to bring the total market cap of crypto assets above $4T for the first time in history. ETH reached its highest levels all year, breaking past $3,800, while SOL, which for the past two weeks had underperformed other L1 blockchains, crossed the $200 threshold. Crypto Week also saw the signing of the GENIUS Act into law by US President Trump, and the passing of the CLARITY Act and the CBDC Anti-Surveillance State Act by the US House.

The beginning of “Crypto Week” saw a number of positive developments for the crypto industry. As the week began, BTC surged to a new all-time high of $123K. However, as the week’s end approached, the spotlight switched toward altcoins, which rallied significantly to bring the total market cap of crypto assets above $4T for the first time in history. ETH reached its highest levels all year, breaking past $3,800, while SOL, which for the past two weeks had underperformed other L1 blockchains, crossed the $200 threshold. Crypto Week also saw the signing of the GENIUS Act into law by US President Trump, and the passing of the CLARITY Act and the CBDC Anti-Surveillance State Act by the US House.
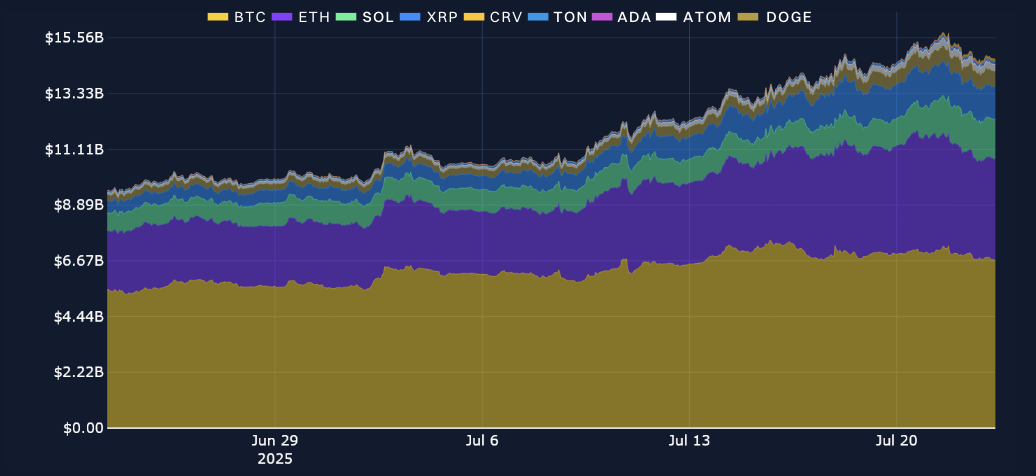
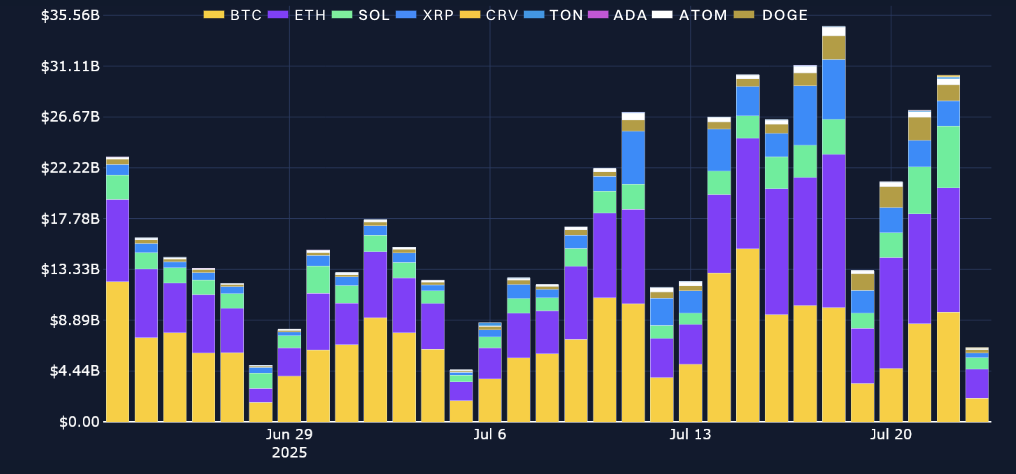
Perpetuals: Amidst the rally and the 5% drop in Bitcoin dominance, open interest once more reached a new high for July of over $15B.
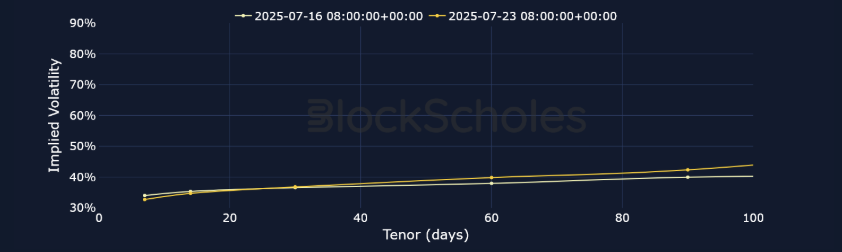
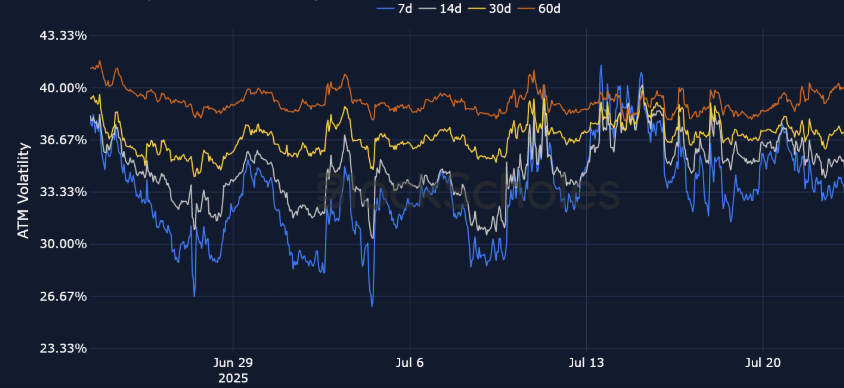
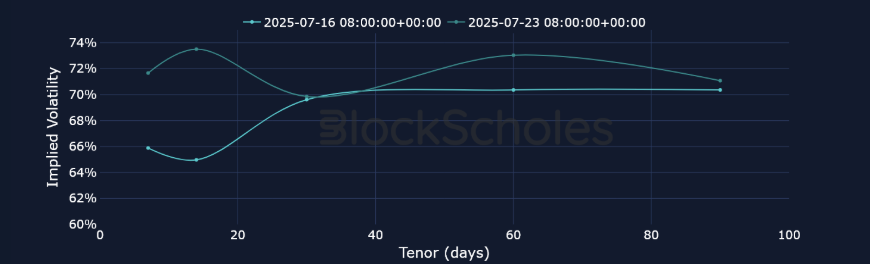
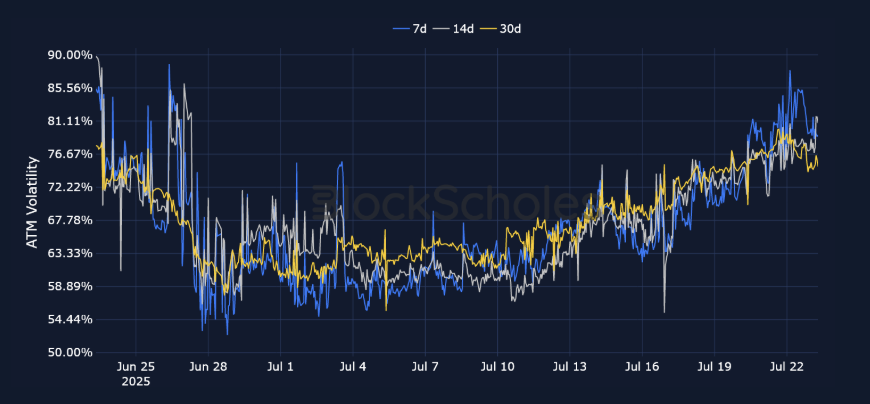
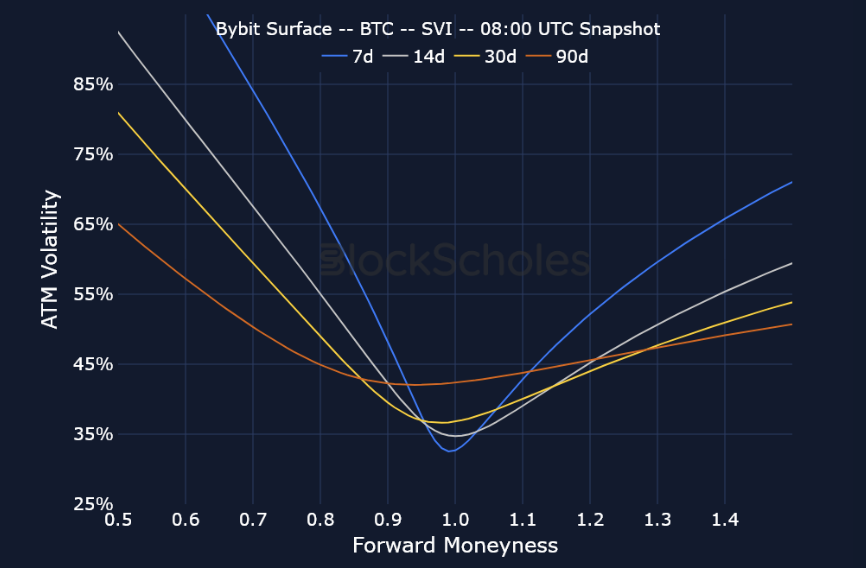
Options: The term structures of volatility for ETH and SOL inverted as their spot prices rallied. However, both term structures have now compressed. Meanwhile, BTC options have traded with an implied volatility between 31% and 41% since Jul 14, 2025.
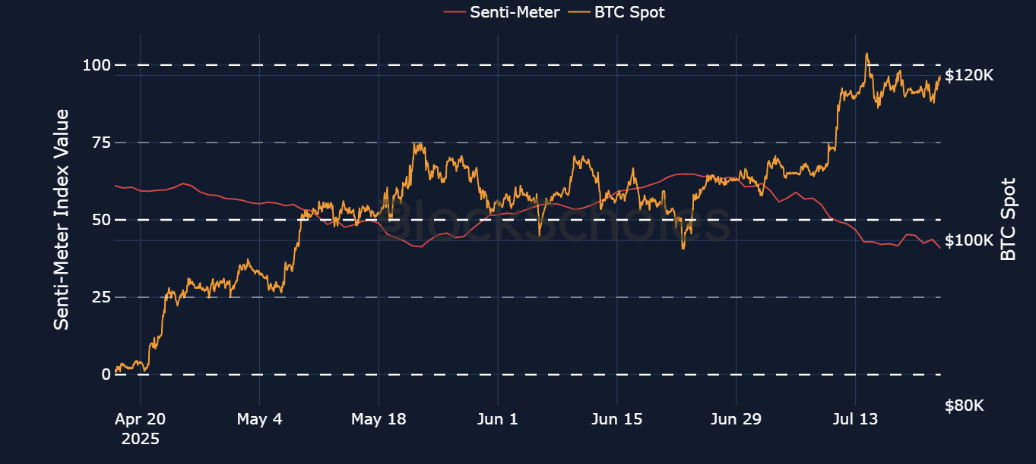
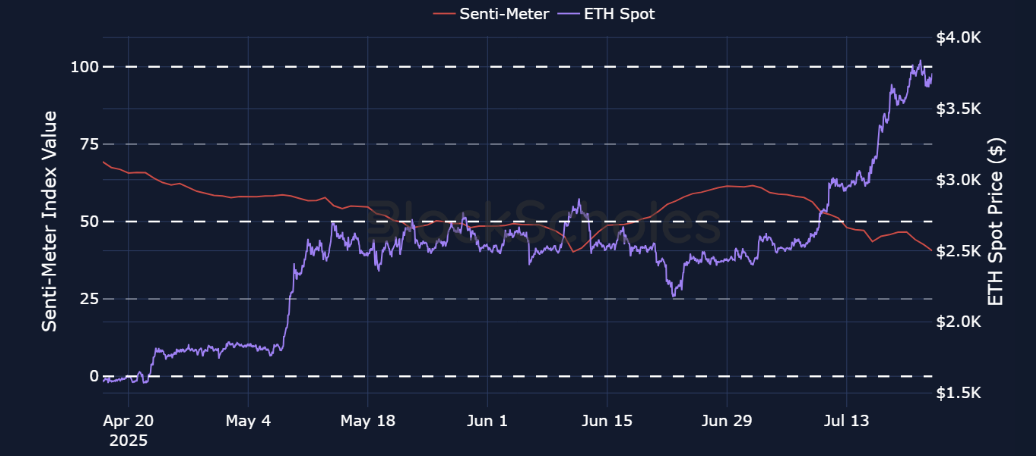
Block Scholes’s Senti-Meter Index aggregates the funding rate, future-implied yield and volatility smile skew into a single expression of sentiment in derivatives markets. See more in the methodology article here.
What was dubbed by President Trump and a congressional committee as “Crypto Week” from Jul 14–18, 2025 did in fact turn out to be a major week for the crypto industry. The US House passed the GENIUS Act, which had already been passed in the US Senate and was later signed into law at the end of the week. The US House also passed the CLARITY Act and the CBDC Anti-Surveillance State Act, which are now set for debate in the Senate. In addition, the week began with a rally in BTC that saw it touch multiple new all-time highs. But as the week progressed, altcoins stole the spotlight, with the total market cap of crypto assets exceeding $4T for the first time in history.
Open interest in perpetual futures surged, in line with the rally in altcoins, and reached a new high for the month on Jul 21, 2025, exceeding $15B. Since then, open interest in altcoins has declined while remaining relatively flat for BTC. Perpetuals trading volume peaked on Jul 18, 2025, as altcoins like Ether began to surge with the passage in the US of the GENIUS Act (and is currently up more than 60% over the past 30 days).
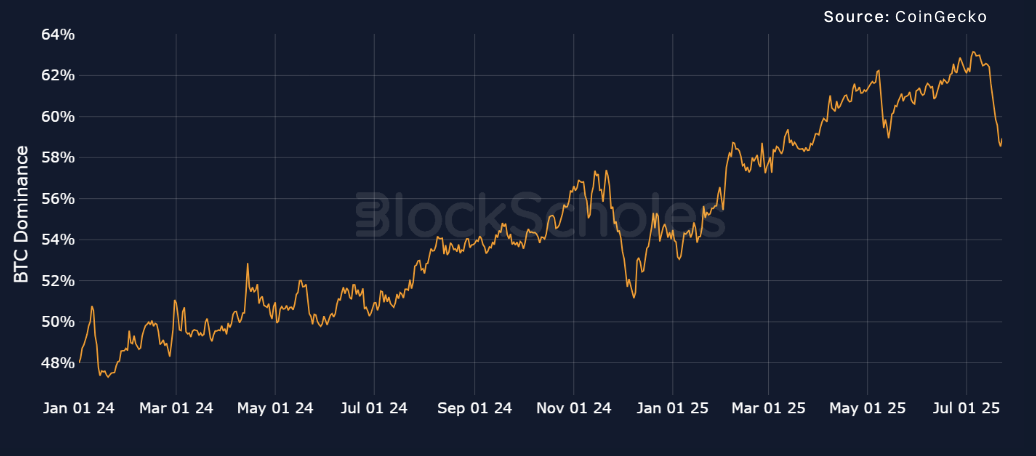
Last week began with a rally in BTC’s price, but as traders took profits at historically high levels, BTC pulled back to $116–117K, and altcoins took the spotlight. ETH surged as high as $3,800, its highest level so far in 2025, while the rest of the altcoin market rallied to bring the total crypto market cap to over $4T — a level at which it continues to trade. That move lower in BTC spot price and the opposite move higher in altcoins saw BTC dominance drop five percentage points to below 60%.
We need not look any further than the funding rate on perpetual swap contracts to see how “Crypto Week” ignited the risk appetite for digital assets. Funding rates across the board have been almost aggressively positive. Readers will notice that it’s a slightly rarer phenomenon to see funding rates exceed 0.02% on an eight-hourly basis. Indeed, over the past seven days, we’ve seen just that for a slew of altcoins, including SOL, XRP, DOGE, CRV and ADA.

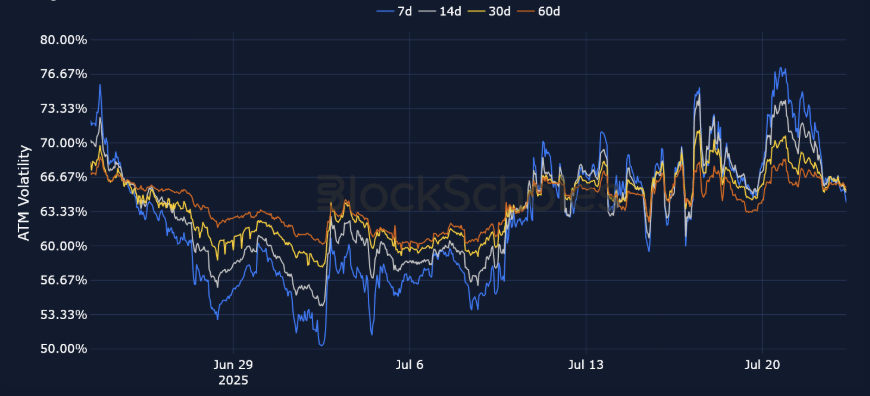
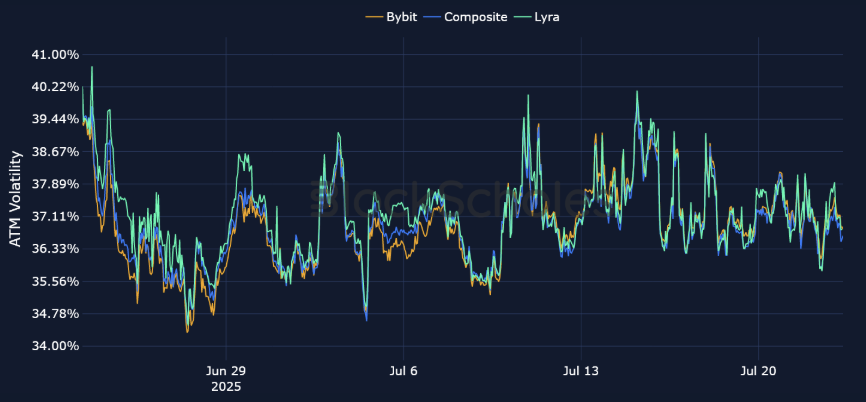
Since Jul 14, 2025, at-the-money implied volatility for 7-day BTC options has traded between 31% and 41%. On Jul 15, 2025, short-tenor volatility jumped to 41% as BTC traded above $120K. However, as its spot price fell as low as $116K on Jul 21, 2025, implied volatility dropped eight percentage points to 32%. However, the past week hasn’t seen short-tenor volatility drop below 30% yet, with Jul 4, 2025 still marking the lowest levels of volatility seen so far this month (at 26%) when BTC traded sideways at $108K.
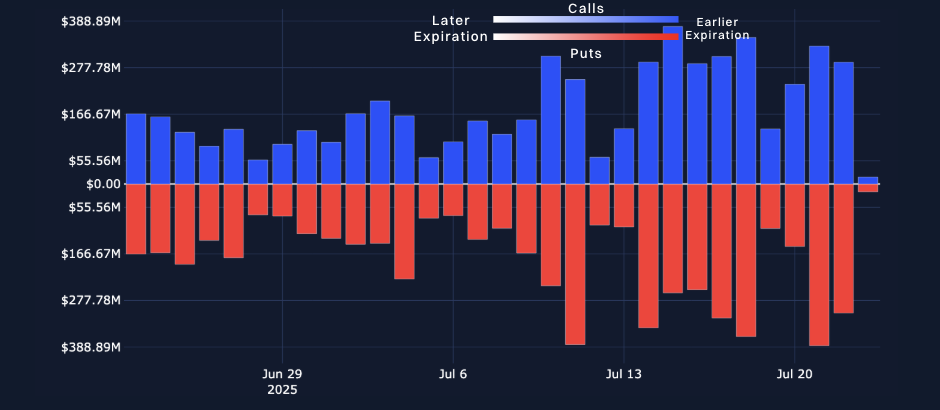
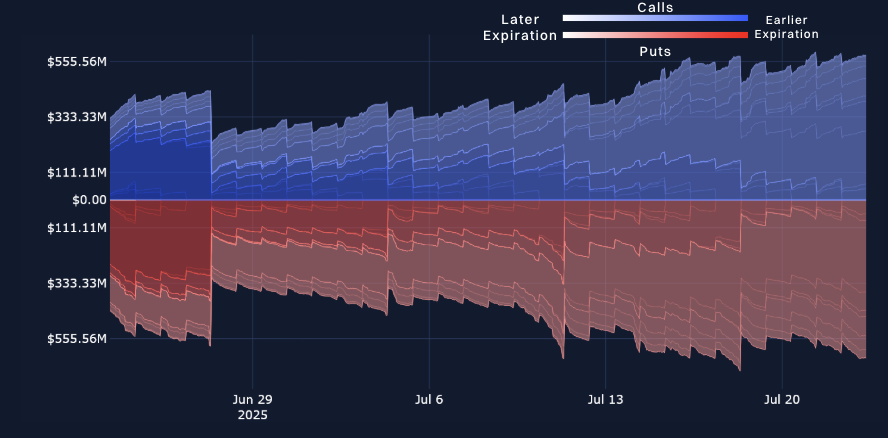
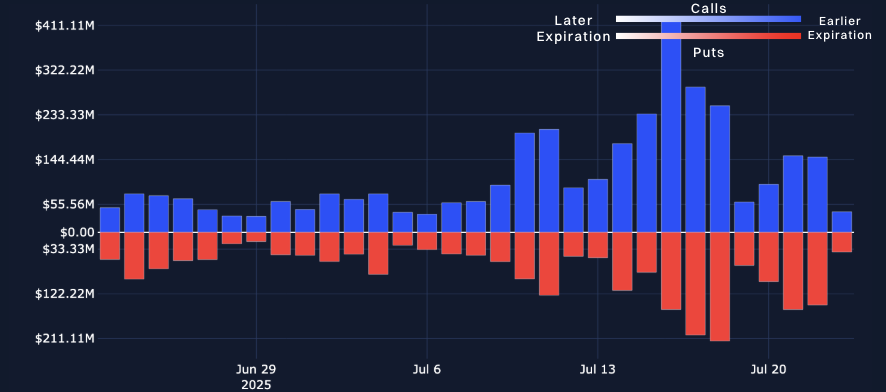
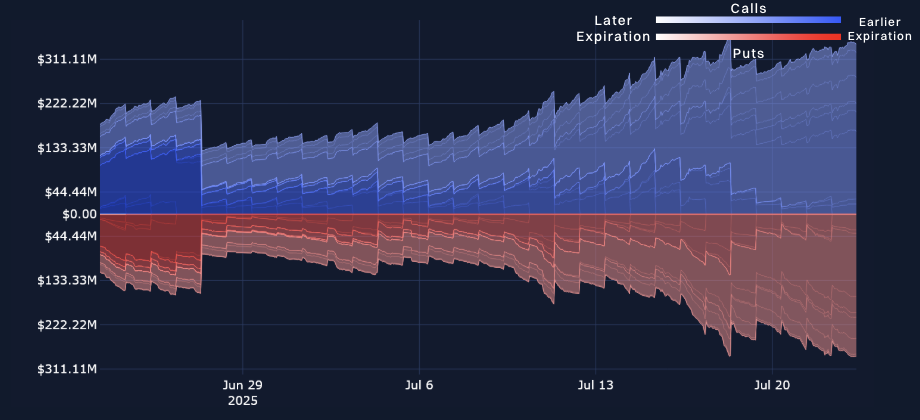
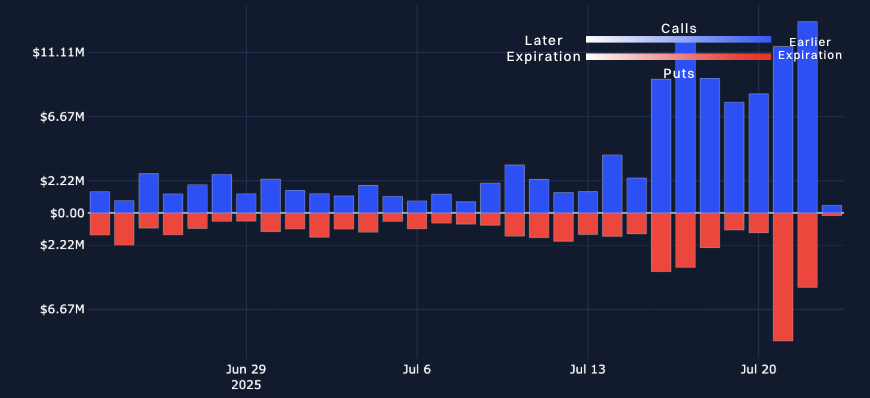
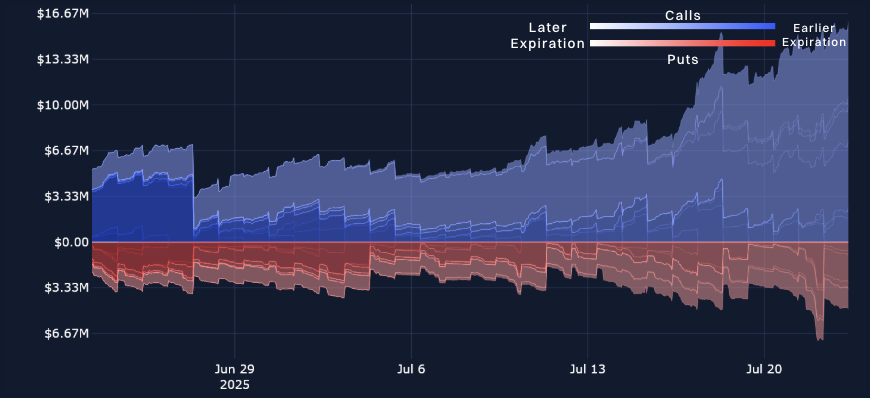
More recently, outflows for Bitcoin Spot ETF products have coincided with the pullback in Bitcoin’s spot price. After maintaining a positive run of consecutive inflows since Jul 2, 2025, the past two trading days have been marked by net outflows for spot ETFs. On Jul 22, 2025, ETFs sold $68M worth of Bitcoin, while just a day earlier outflows amounted to $131.4M. As we saw last week, open interest for BTC options is currently equally balanced between call and put options at $555 million.
Even with BTC reaching a new all-time high, the attention has been on Ether (ETH), its price more than doubling since April lows of $1,500 amidst President Trump’s reciprocal tariffs drama. The Ethereum network (and its native ETH token) has been bolstered by a number of tailwind factors. ETH Spot ETFs have maintained positive inflows throughout most of July, even seeing their best day of inflows over the past week since their launch. A slew of companies are also increasingly looking at ETH treasury strategies. SharpLink Gaming, for example, overtook the Ethereum Foundation as the largest corporate holder of Ether, while the Ether Machine, a newly formed entity that merged with Dynamix Corporation, plans to trade on the Nasdaq-100 soon, with more than 400,000 ETH on its balance sheet.
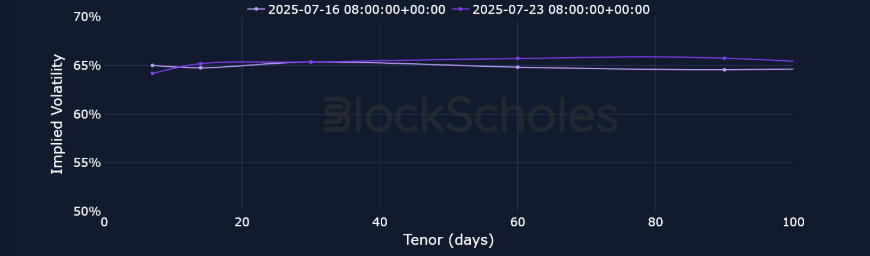
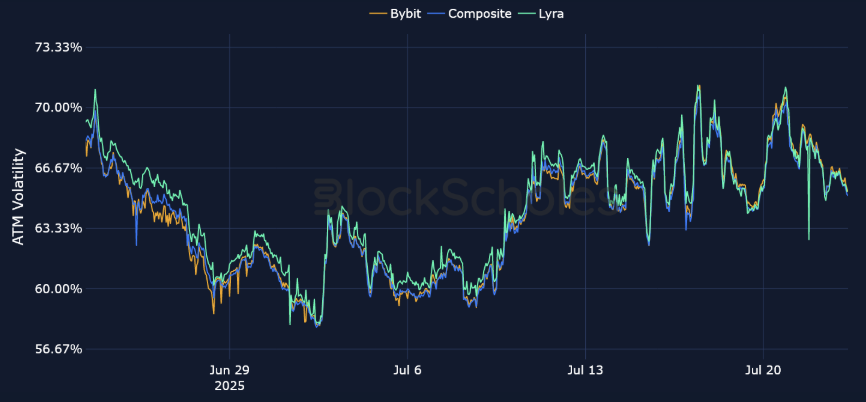
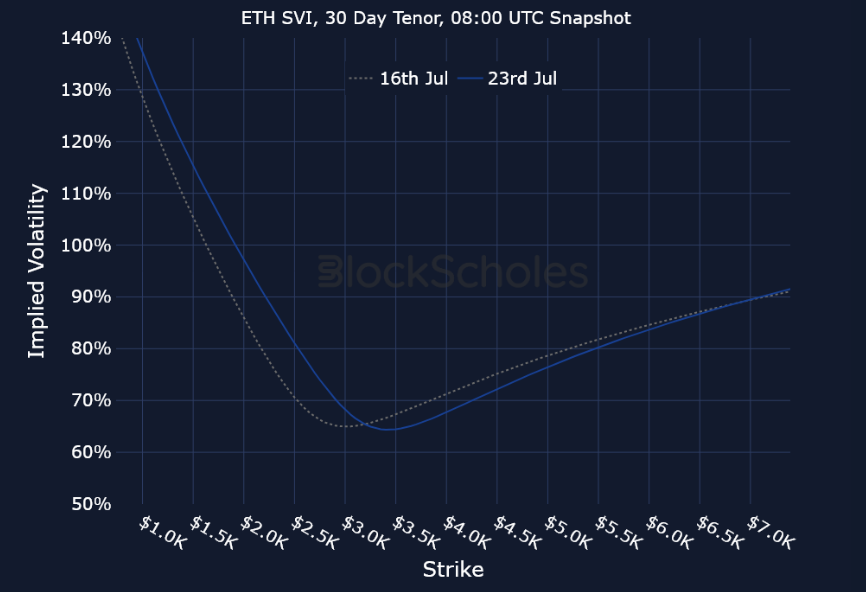
ETH’s term structure of volatility has completely compressed to between 64–65%, following an inversion as its spot price surged to $3,800. Options volumes and open interest are both currently dominated by call options for ETH as well.
Over the past two weeks, we’ve highlighted the positive developments bolstering the Solana ecosystem, and yet it’s underperformed relative to a basket of other large L1 blockchains. Over the past week, however, SOL has regained its footing, and it’s up 19% within the past seven days and trading just short of $200 after touching $205 earlier in the week. This means that the SOL token has outperformed the 15% rally in ETH, 5% rally in TRON and −2.5% decline in SUI over the same period. Meanwhile, the REX-Osprey SOL Staking ETF continues to see positive net flows.
The bullishness in SOL’s spot price is reflected in its derivatives markets, too. As we highlighted earlier, perpetual swap funding rates exceeded 0.02% earlier in the week, call options volumes surged recently to $8M, and open interest in call options is over 3x larger than that for puts.
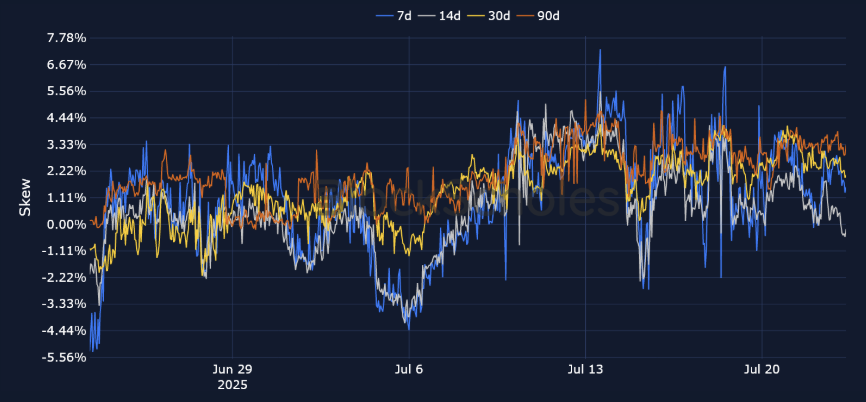
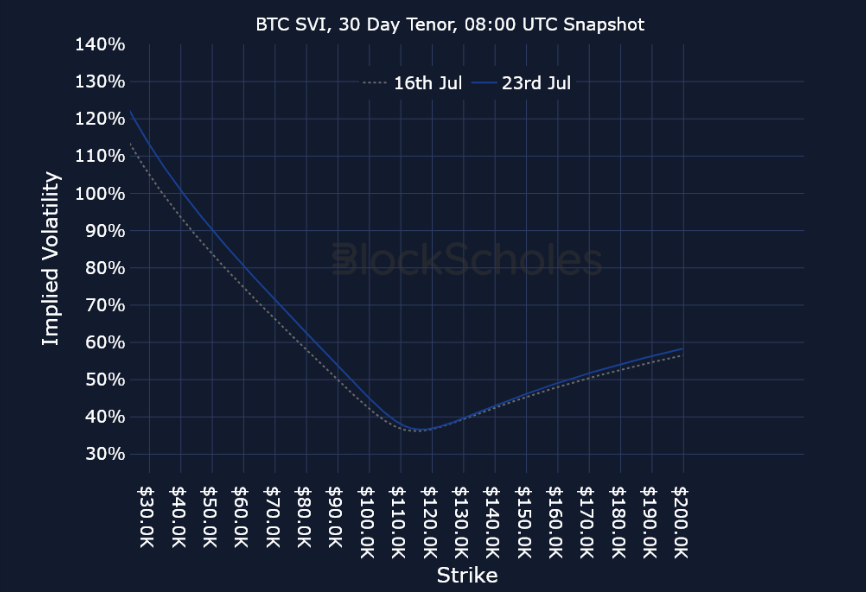
During the run-up to several new all-time highs, short-tenor volatility smiles for BTC skewed strongly toward OTM call options. As BTC broke past $120K on Jul 13, 2025, the volatility premium assigned to OTM calls was 7% higher than that for similarly dated OTM put options. As BTC subsequently sold off, the put-call skew ratio temporarily tilted toward OTM puts before bouncing back again. Currently, 7-, 30- and 90-day BTC options all have a positive put-call skew, while 14-day options are slightly below 0% (at −0.2%).
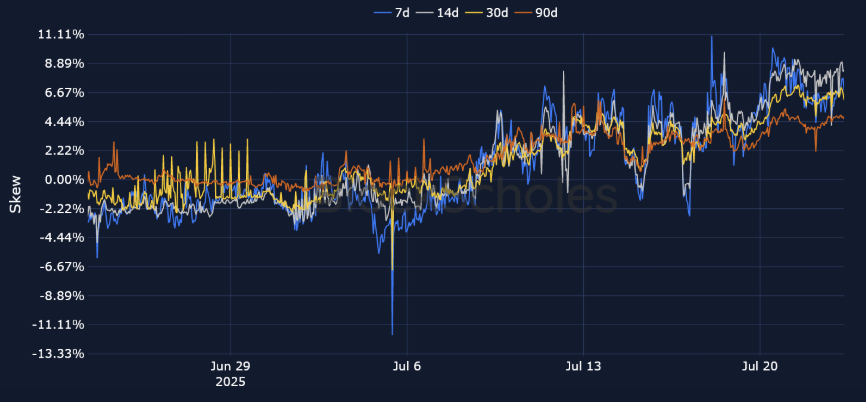
The moves in options markets for ETH have been more dramatic, as the put-call skew rose as high as 11%, mirroring the directional sentiment in other derivatives markets metrics, such as futures spot yields and perpetual swap funding rates. Currently, volatility smiles across the term structure for ETH are skewed toward call options, with the skew on 7-day ETH options at 6.8%.

Open interest and trading volume data are sourced “as is” from the Bybit exchange platform API exclusively, and as such do not represent a comprehensive picture of the sum of trading activity across all derivatives markets or exchanges. The data visualized in this report consists of hourly and daily snapshots, recorded over the previous 30 days. Daily (hourly) snapshots of trade volume record the total sum of the notional value of trades recorded in the 24H (1 hour) period, beginning with the snapshot timestamp.
If not explicitly labeled as derived from another exchange, the input instrument prices to all derivatives analytics metrics in this report are sourced from the appropriate endpoints of Bybit’s public exchange platform API. In the event that data is labeled or referred to as representing the market on another exchange source, that data is sourced from the appropriate endpoint of each respective exchange’s public API.
Macroeconomic charts and data are sourced “as is” from the Bloomberg Terminal. Exchange data is sourced “as is” from publicly available exchange APIs. Block Scholes makes no claims about the veracity of public third-party data.
After acquisition of underlying-denominated raw data for open interest and trading volume on the Bybit exchange platform from Bybit’s API endpoint, equivalent dollar-denominated figures are calculated using the concurrent value of Block Scholes’s Spot Index for the relevant underlying asset.
Block Scholes’s Spot Index represents the aggregate Spot mid-price for a given currency across the top five CEXs by volume (with USD-quoted markets). It considers the proportion of total volume in the instrument on the exchange, as well as the deviation of a data point from those on other exchanges.
Futures prices are used for Block Scholes’s futures-implied yields calculation services in order to derive the constant-tenor annualized yields displayed in the Futures section of this report.
Options prices are used for Block Scholes’s implied volatility calculation services in order to calibrate volatility surfaces, from which all derivatives volatility analytics displayed in the BTC Options and ETH Options sections of this report are calculated. Volatility smiles are constructed by calibrating to mid-market prices observed in Bybit options markets. As part of the calibration process, prices go through rigorous filtration and cleaning steps, which ensures that the resulting volatility surface is arbitrage-free and has exceptional fit to the market observables.

.jpg)


.jpg)


.jpeg)


.jpg)


.jpg)
