Thahbib Rahman
Research Analyst
A slow-but-steady recovery in macro risk appetite has also seen crypto stage a modest recovery from its weekend lows. After revisiting spot prices not seen since April 2025, BTC and ETH now trade above $91K and $3K respectively.

A slow-but-steady recovery in macro risk appetite has also seen crypto stage a modest recovery from its weekend lows. After revisiting spot prices not seen since April 2025, BTC and ETH now trade above $91K and $3K respectively.
Derivatives markets reflect this recovery, as altcoin perpetual swaps have printed several sessions of positive rates after a strong rate charged to holders or short positions over the weekend. Short-tenor implied volatility levels no longer trade at such an extreme premium after the normalization of the term structure of volatility, and puts no longer hold as strong a premium above calls (despite not fully pricing out a preference for downside protection).
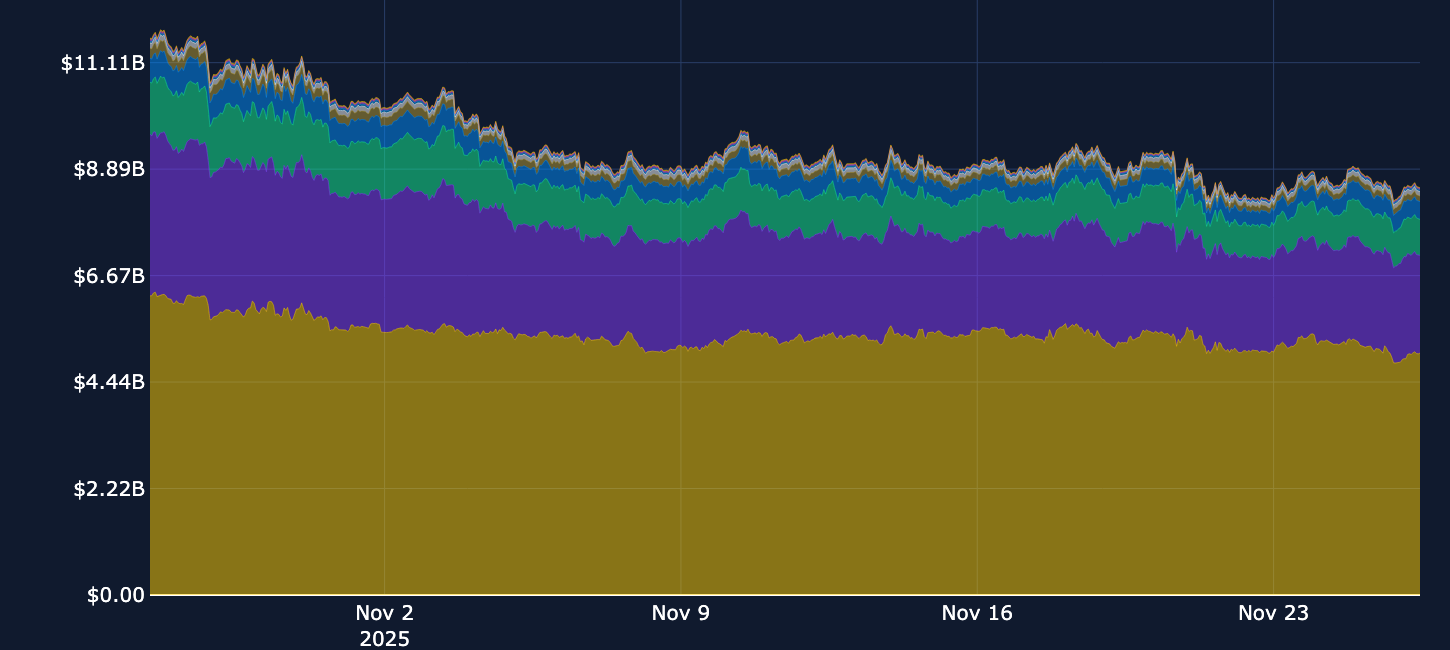
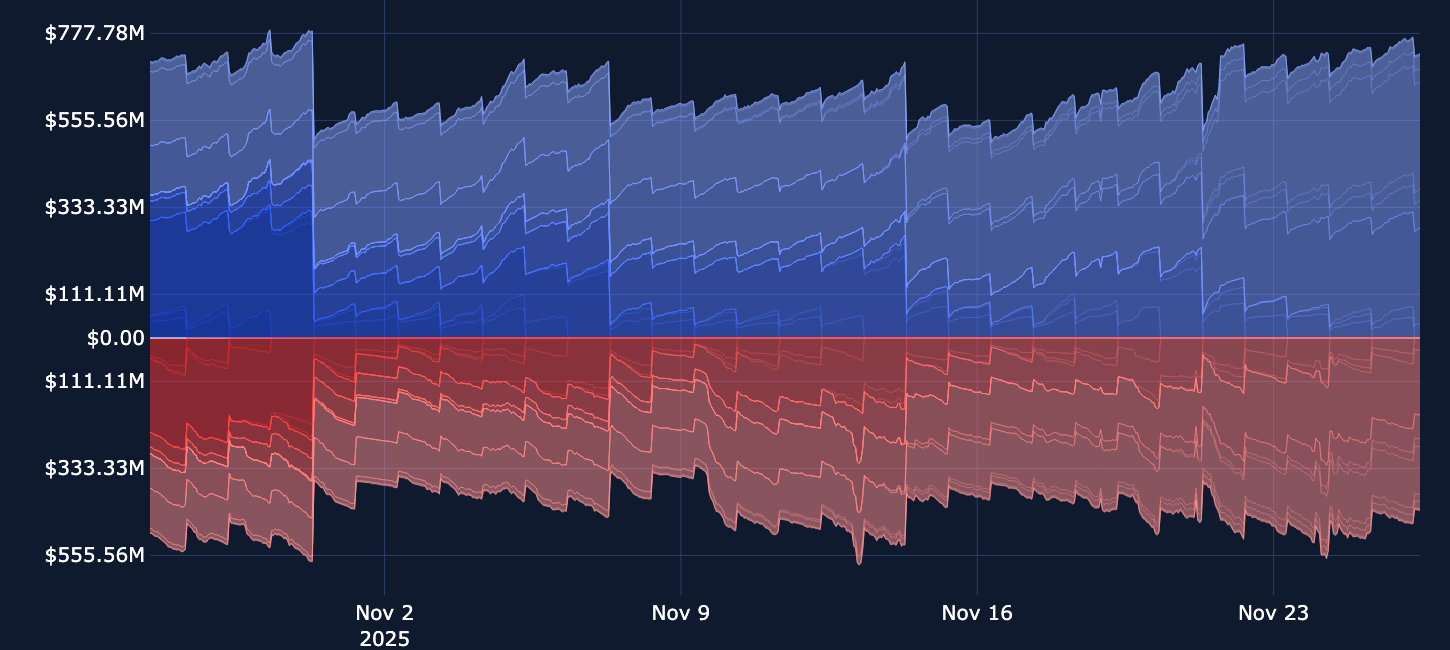
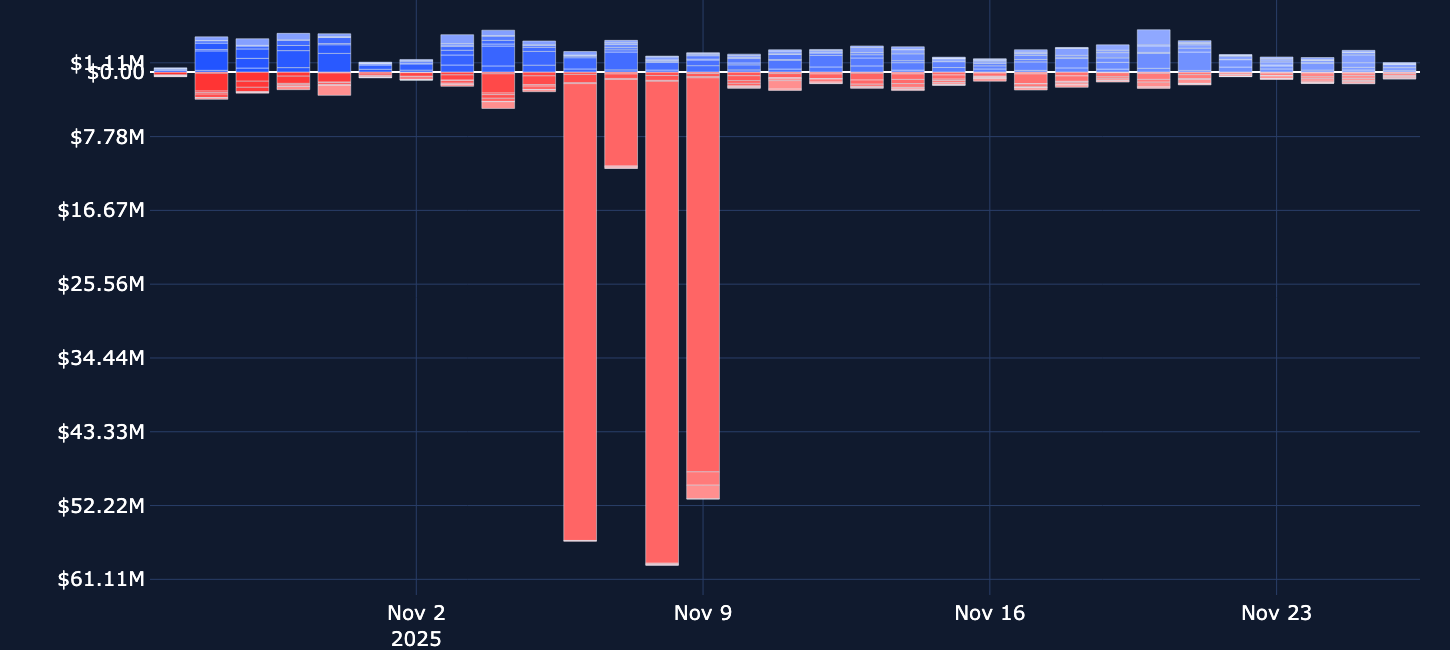
However, measures of participation rates in derivatives remain subdued long after Oct 10, 2025's liquidation event, and open interest and volumes remain relatively low across instruments.
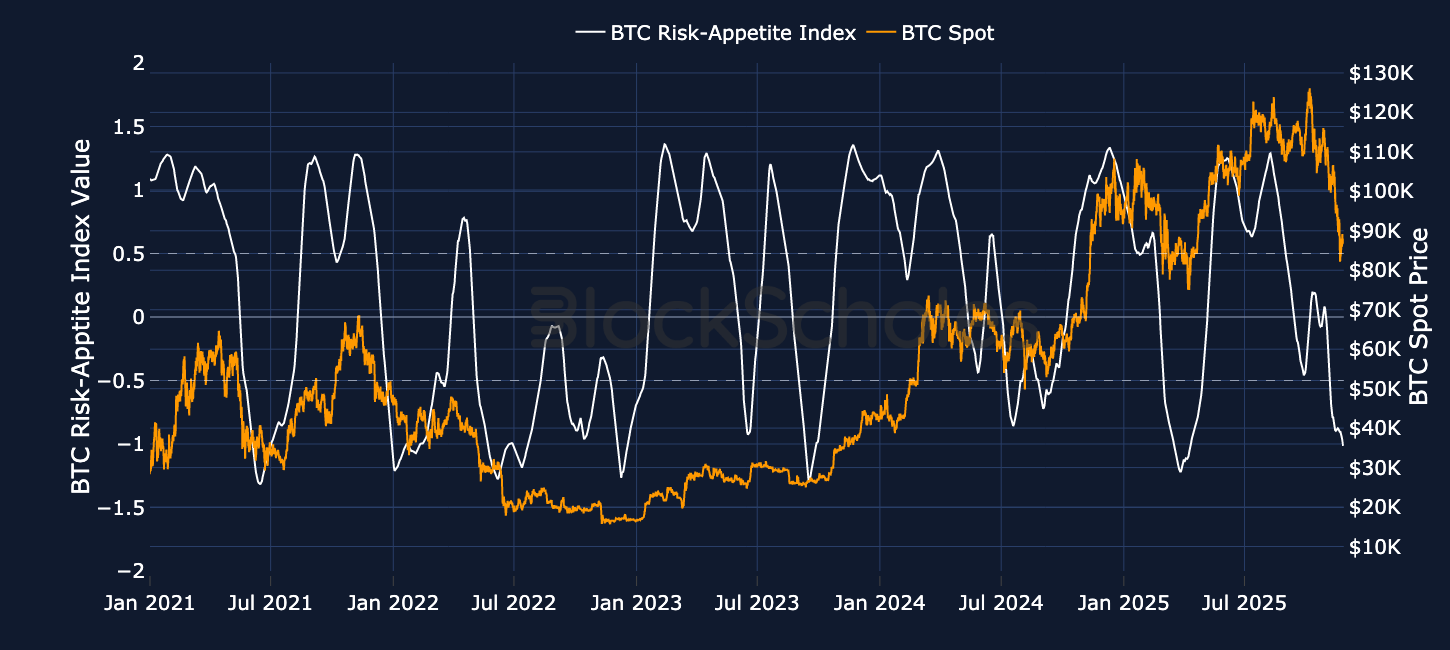
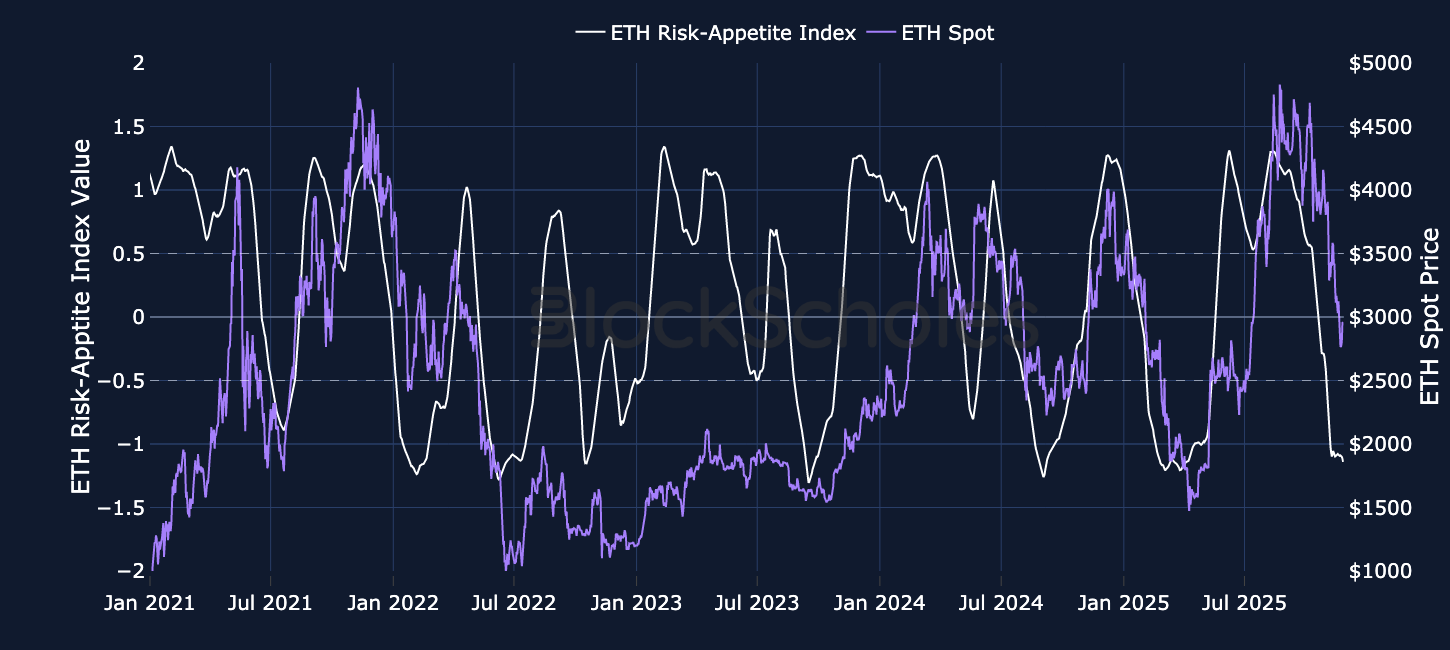
Block Scholes’ Risk Appetite Index measures the level of euphoria (above 1) or panic (below -1) in the spot market. Momentum in this index shows a strong relationship to spot returns.
Monad (MON) is a new Layer 1 blockchain that promotes itself as an Ethereum-compatible network offering a throughput of around 10,000 transactions per second, 400ms block times, and roughly 800ms to finality. Monad’s whitepaper highlights its Ethereum-like design, noting full EVM compatibility and an open-source codebase that lets developers migrate existing Ethereum smart contracts and applications without modification to Monad. After several years in development, it has emerged as one of the more closely watched “next-generation” chains.
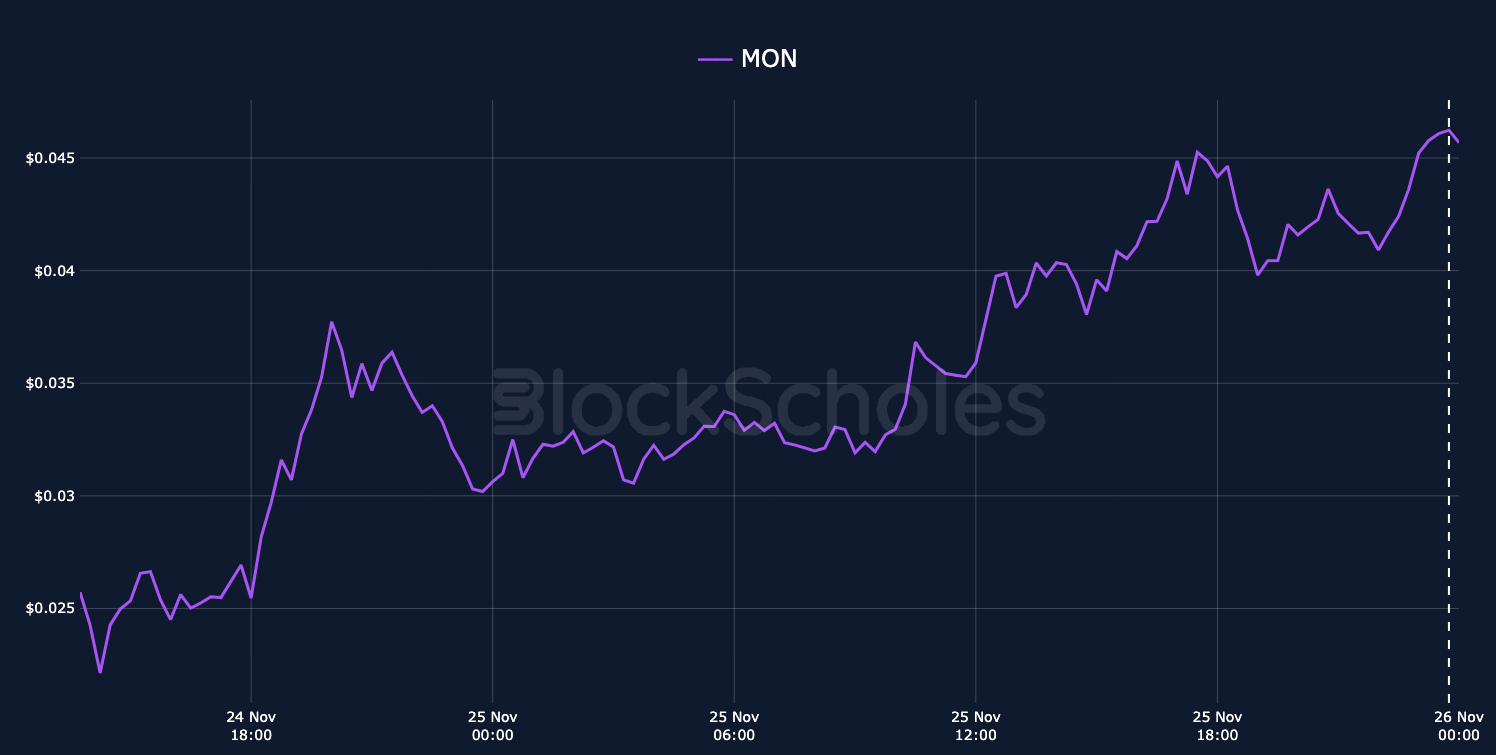
The network operates on a Proof-of-Stake (PoS) consensus mechanism and is secured by a group of validators. Anyone can run a node to self-verify transaction execution, and the system is designed to keep hardware demands low. Monad’s mainnet and token went live on Monday, Nov 24, 2025. Within 24 hours, MON became the best-performing asset in the top 100 by market capitalization and briefly hit a high of $0.045 on Tuesday. The launch was accompanied by listings on major exchanges, with Bybit adding MON to its spot trading platform on launch day and promoting the listing ahead of time.
The move followed a public token sale, where Monad sold 7.5B MON between 17 and 22 Nov, 2025 implying a $2.5B valuation. The sale raised around $50M and attracted nearly 86,000 participants, an unusually broad retail base. When trading opened on Monday, fresh demand pushed MON up about 78%, lifting its implied valuation to almost $4B.
On Solana, MON trading volume exceeded $87M in just 24 hours, surpassing activity on Monad itself and outstripping Hyperliquid (HYPE) by around 149%, helping to make Solana the fifth-largest onchain venue for MON trading by total volume.
On-chain, Monad has already processed over 3M transactions from roughly 140,000 addresses, with more than 18,000 smart contracts deployed.
MON has risen from about $0.025 to over $0.045 since 24 November:
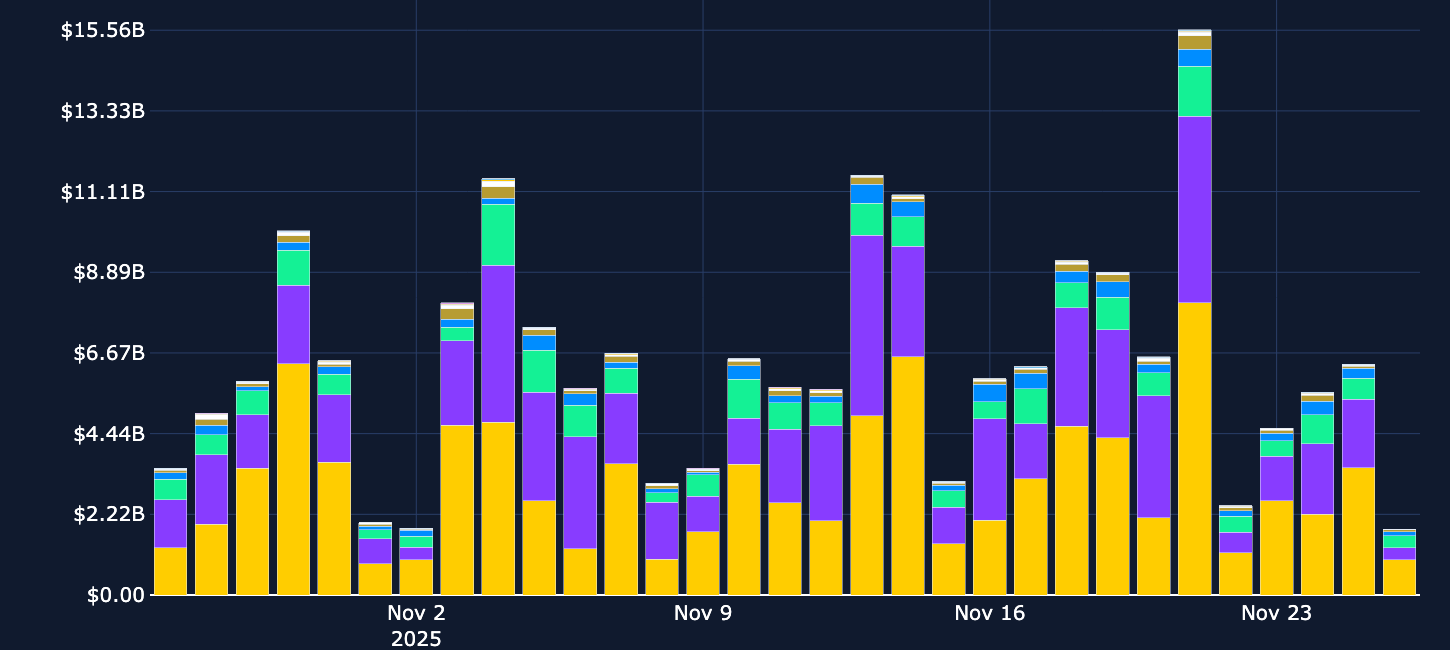
The Oct 10, 2025 sell-off saw around $19B of positions liquidated, the largest in crypto history. The closure of positions was clear in charts of the open interest of large market-cap altcoins. The most recent sell-off shows almost none of the tell-tale signs of liquidation cascade to send prices spiralling lower, suggesting a far lower participation rate of leveraged long positions during the last week of bearish spot price action. For altcoins, we can correlate that lack of leveraged long positions with a strong, negative funding rate, which indicates high relative demand to short the asset via the derivative contract. However, BTC and ETH’s positive funding rates for much of this period suggest a far lower participation rate altogether.
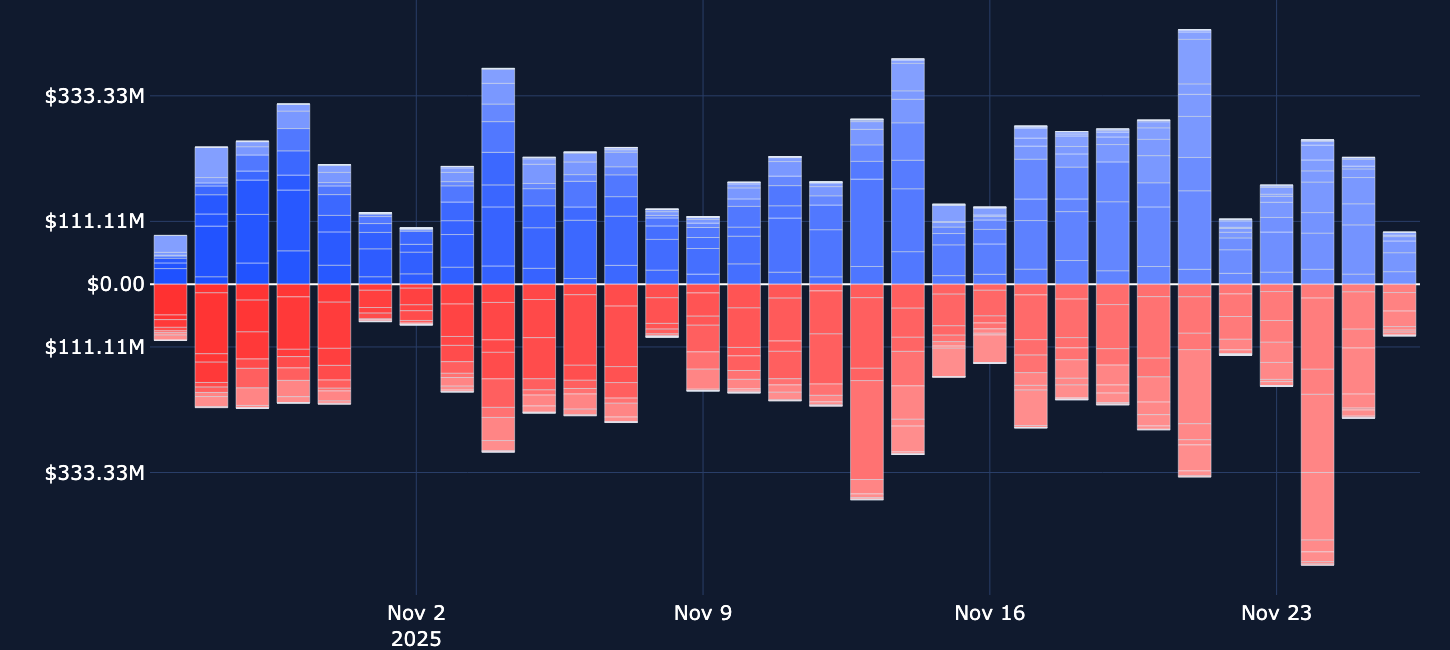
Several large market-cap altcoins with significant open interest in perpetual swaps, including SOL, TON, CRV, and ADA, have recorded positive funding rates during the slow-and-steady recovery rally higher. However, the significant underperformance that altcoins have recorded in spot prices relative to BTC during the sell-off was reflected in perpetual swap funding rates. Where BTC and ETH have recorded consistently positive rates over the last two weeks, the weekend of Nov 22 and Nov 23, 2025 saw leveraged short positions in altcoin pairs charged a fee for the privilege of their short exposure.

BTC, along with other crypto-assets, has staged a steady recovery from last week’s extreme bearishness. The largest crypto-asset by market cap now trades above $91K, having just last week revisited price levels not seen since April 2025.
Crypto-assets have staged this recovery in tandem with a wider improvement in risk-on sentiment exemplified by the move higher in the S&P 500 index. Further clarity in the macroeconomic picture is at least partly to blame – the slew of economic data releases brought about this week since the end of the U.S. government shut-down has cleared at least some of the fog that clouded Fed participant’s judgement of the Dec 10, 2025 monetary policy meeting. In addition, Fed speaker John Williams on Friday gave the clearest indication that the Fed may be able to reduce rates by a further 25bps for a third consecutive meeting, resulting in market-implied odds of a 25bps cut rallying above 80%.
BYBIT BTC OPTIONS OPEN INTEREST


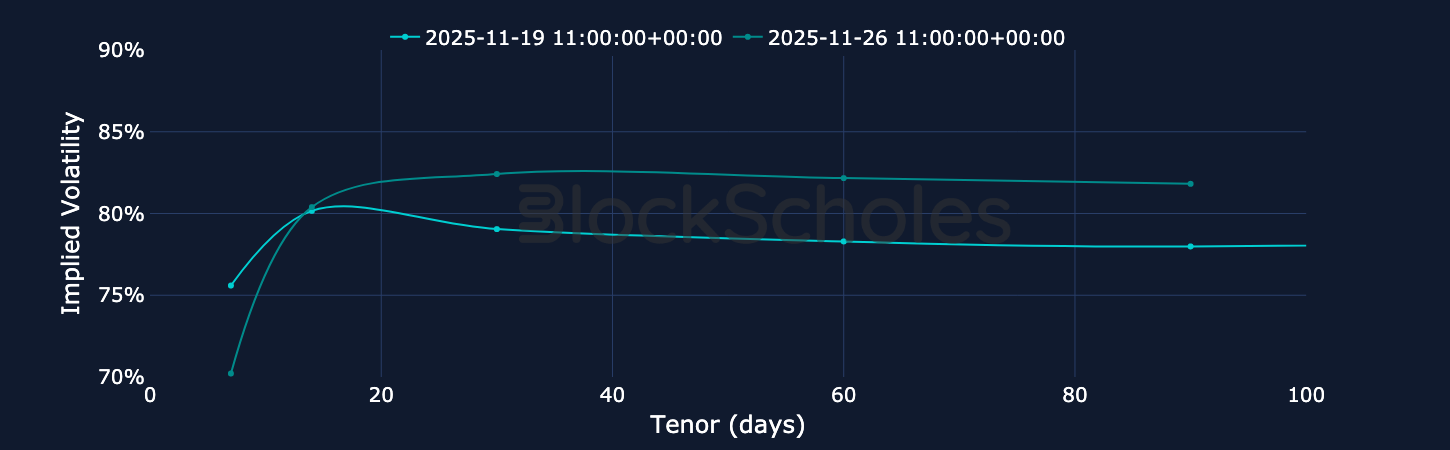
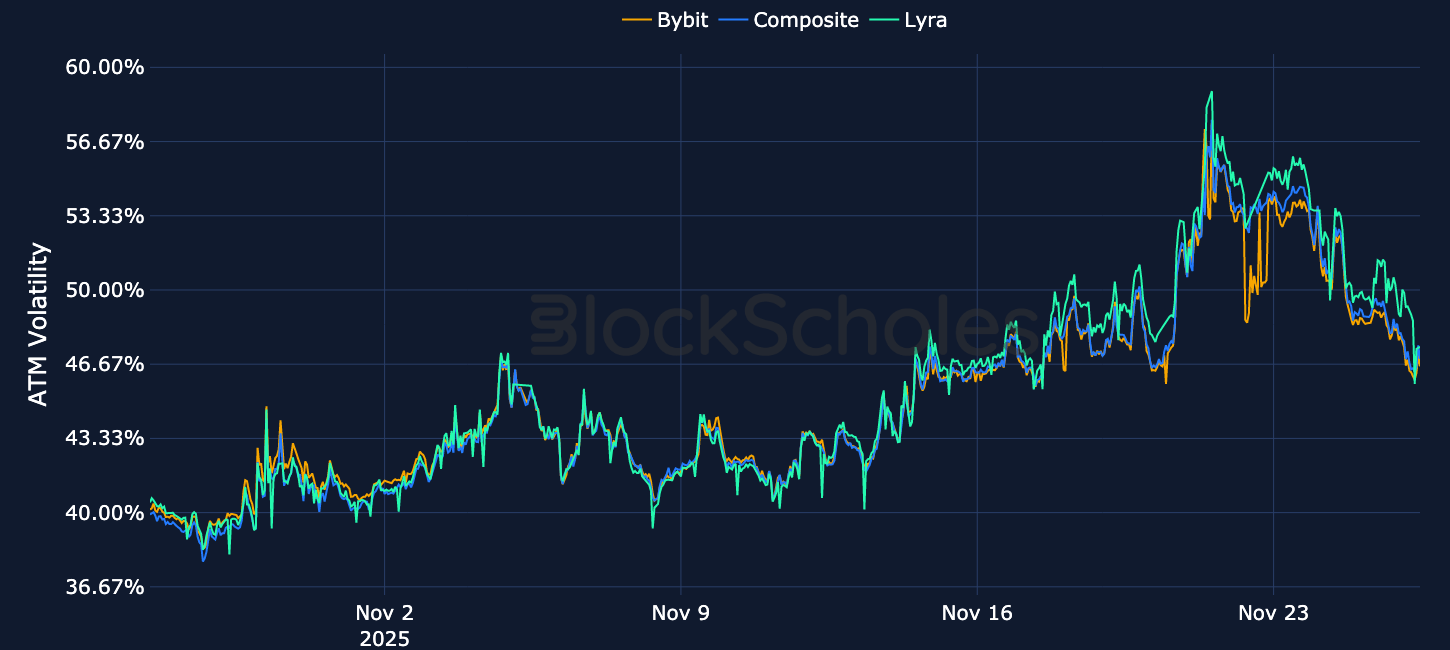
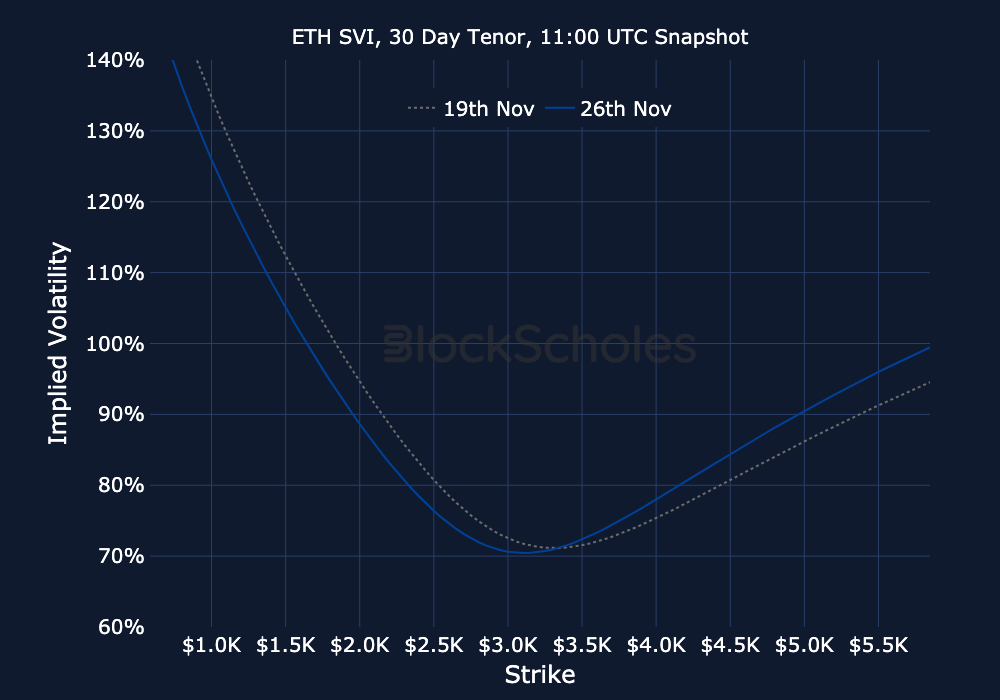
ETH’s retaking of the psychological $3K level has capped off a greater-than-17% recovery (using intraday prices) from the local bottom recorded on Saturday Nov 22, 2025. Alongside the move higher in spot, options markets have tempered their demand for protection against immediate further downside via short-term put options.
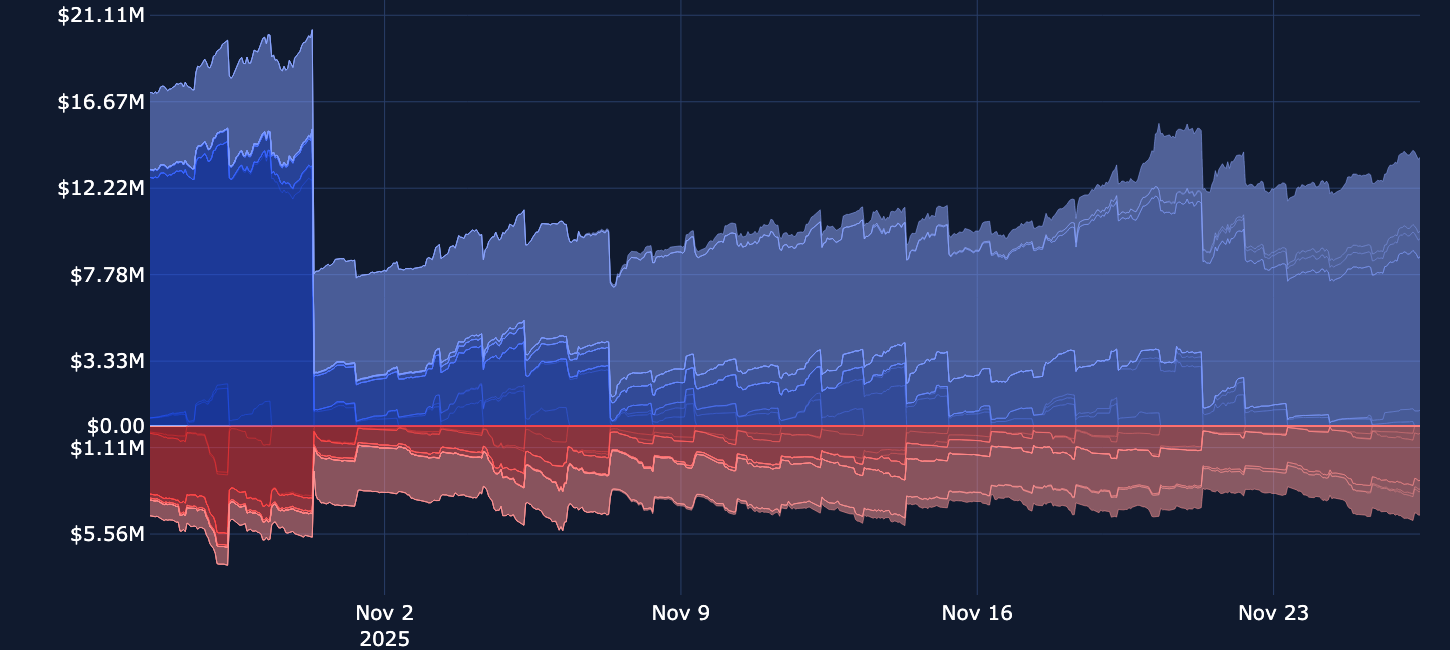
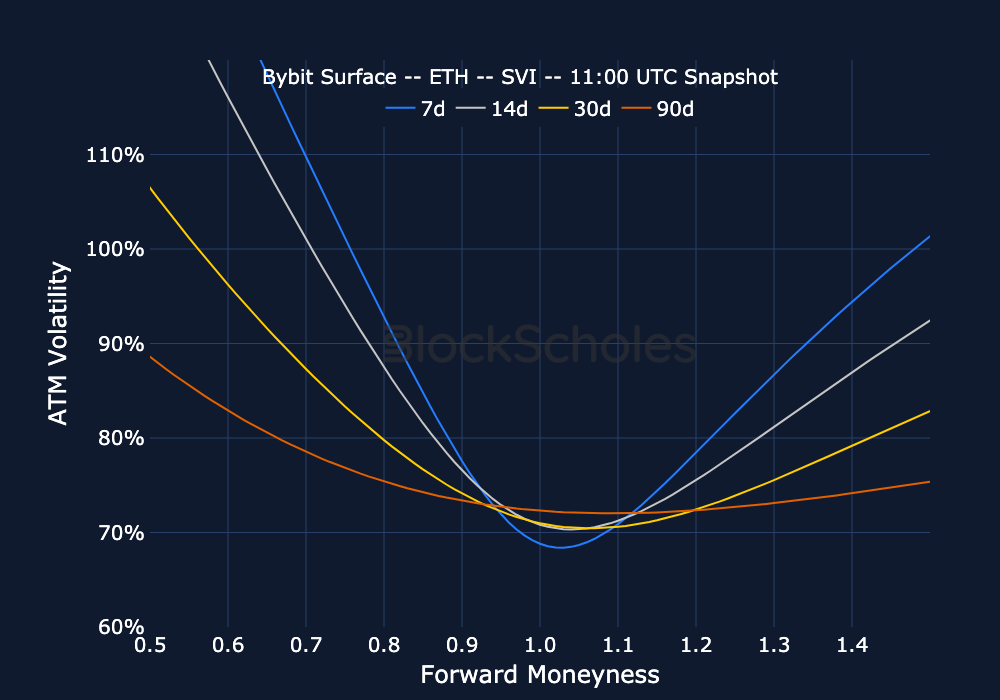
As a result, ETH’s term structure of at-the-money has dis-inverted. In addition, out-of-the-money put options do not trade with as high a premium (now only 3-4% implied vol points above that of calls), indicating a reversal from the most extreme of bearish sentiment. However, participation rates in ETH options markets remain relatively low – in contrast to BTC’s markets, small movements in ETH’s open interest and low trading volumes suggest that traders are less willing to increase exposure in current market conditions.
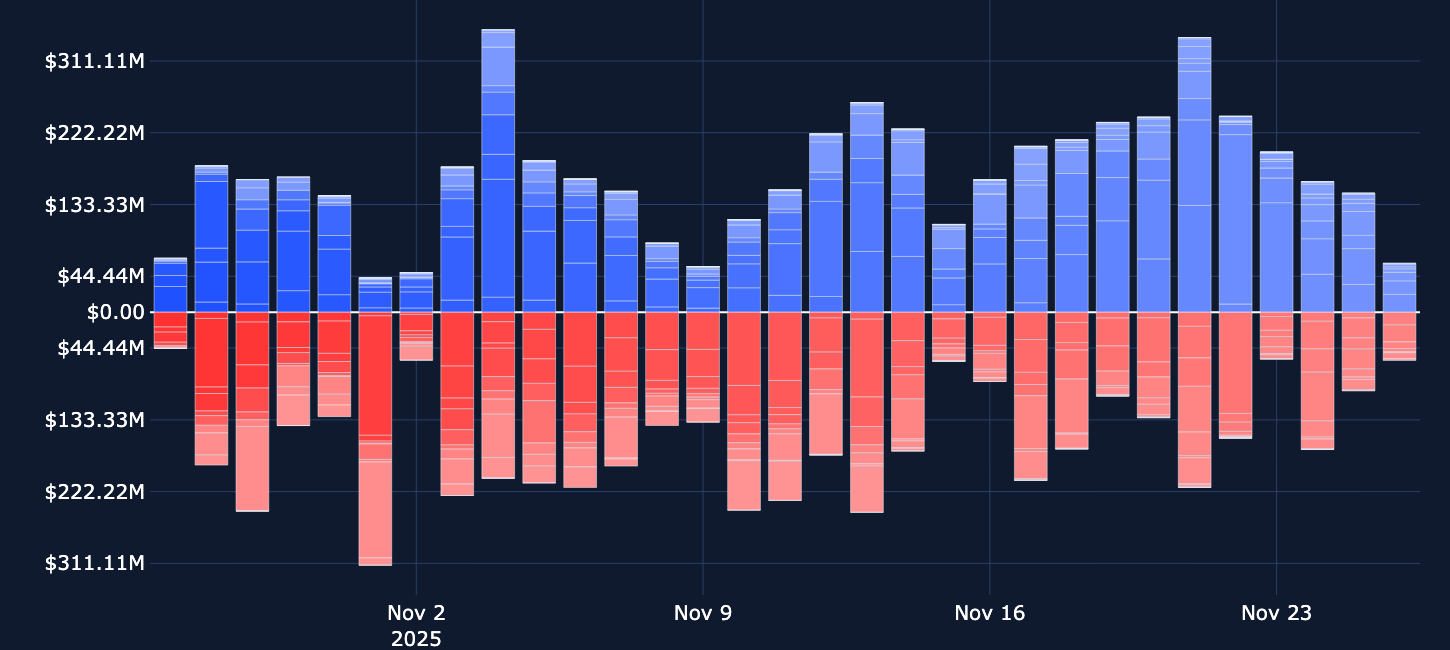


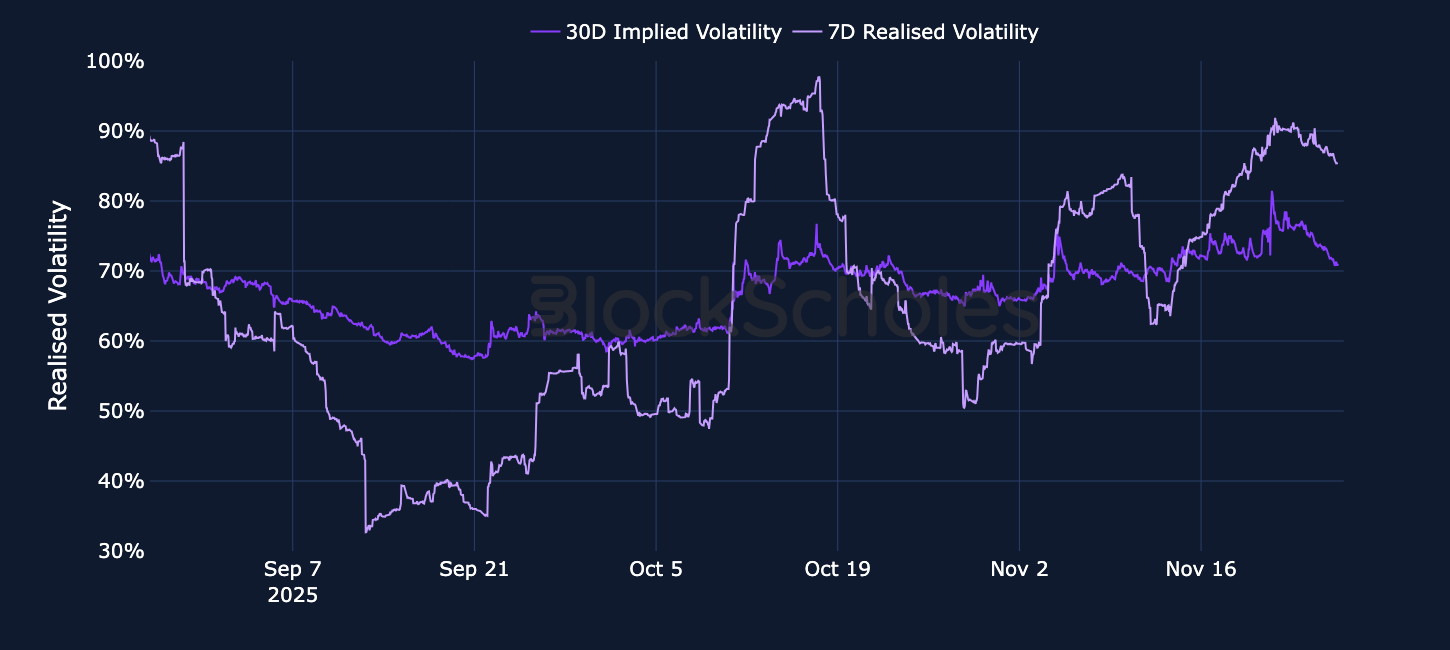
SOL’s level of realized volatility has returned to monthly highs as spot finds a local bottom. Despite this, we have seen implied volatility of short-tenor options fall from their previously elevated levels as traders price for a lower level of volatility in the near-term. Still, trade volumes have remained far below the levels that we saw in put options earlier in November. Instead, the small level of volume traded has been more concentrated in call options. This is echoed by the same phenomenon in levels of open interest, which show stronger extant positioning in call options in spite of the bearish spot action. Although we are approaching the end of November, we have not seen a recovery to the open interest levels that were lost due to the expiration of October contracts, reflecting the lower participation rates in other asset classes.


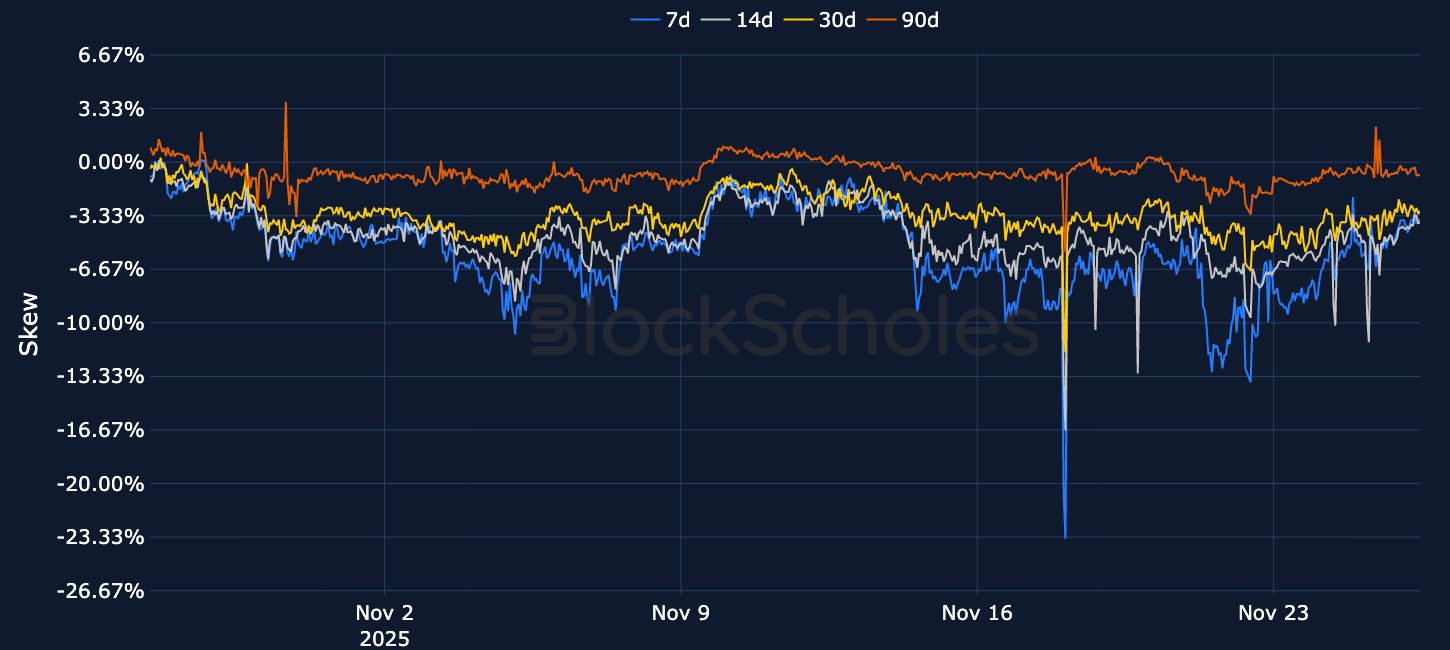
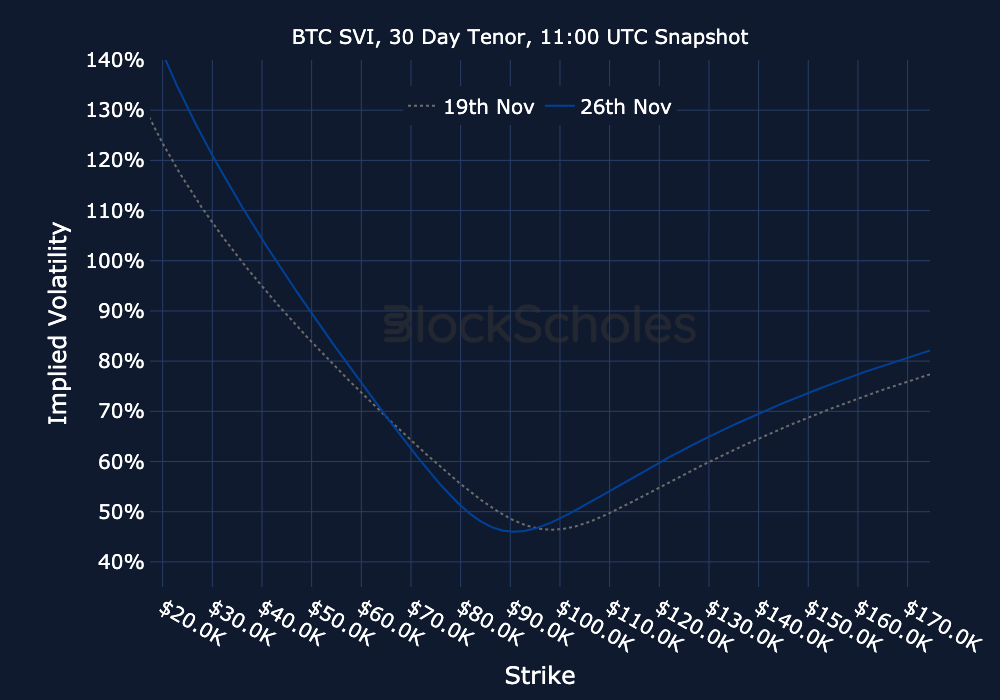
Options markets are showing tentative signs of a recovery in sentiment as last week’s fall in crypto-asset spot prices appears to have found a local bottom. The relative demand for puts expressed by BTC and ETH’s volatility smiles has staged a moderate recovery in tandem with a constructive move higher in spot prices to $89K and $3K for BTC and ETH respectively.
Interestingly, BTC skews reached a more extreme level than ETH’s did during the deepest part of the bearish sentiment, suggesting a higher demand for options to hedge downside exposure in BTC. However, the move higher in sentiment has not been strong enough to see markets reverse all of that bearish positioning, with 7d smiles skewed 6.5% and 3.4% towards puts for BTC and ETH respectively.


Open interest and trading volume data are sourced “as is” from the Bybit exchange platform API exclusively, and as such do not represent a comprehensive picture of the sum of trading activity across all derivatives markets or exchanges. The data visualized in this report consists of hourly and daily snapshots, recorded over the previous 30 days. Daily (hourly) snapshots of trade volume record the total sum of the notional value of trades recorded in the 24H (1 hour) period, beginning with the snapshot timestamp.
If not explicitly labeled as derived from another exchange, the input instrument prices to all derivatives analytics metrics in this report are sourced from the appropriate endpoints of Bybit’s public exchange platform API. In the event that data is labeled or referred to as representing the market on another exchange source, that data is sourced from the appropriate endpoint of each respective exchange’s public API.
Macroeconomic charts and data are sourced “as is” from the Bloomberg Terminal. Exchange data is sourced “as is” from publicly available exchange APIs. Block Scholes makes no claims about the veracity of public third-party data.
After acquisition of underlying-denominated raw data for open interest and trading volume on the Bybit exchange platform from Bybit’s API endpoint, equivalent dollar-denominated figures are calculated using the concurrent value of Block Scholes’s Spot Index for the relevant underlying asset.
Block Scholes’s Spot Index represents the aggregate Spot mid-price for a given currency across the top five CEXs by volume (with USD-quoted markets). It considers the proportion of total volume in the instrument on the exchange, as well as the deviation of a data point from those on other exchanges.
Futures prices are used for Block Scholes’s futures-implied yields calculation services in order to derive the constant-tenor annualized yields displayed in the Futures section of this report.
Options prices are used for Block Scholes’s implied volatility calculation services in order to calibrate volatility surfaces, from which all derivatives volatility analytics displayed in the BTC Options and ETH Options sections of this report are calculated. Volatility smiles are constructed by calibrating to mid-market prices observed in Bybit options markets. As part of the calibration process, prices go through rigorous filtration and cleaning steps, which ensures that the resulting volatility surface is arbitrage-free and has exceptional fit to the market observables.

.jpg)


.jpg)


.jpeg)


.jpg)


.jpg)
