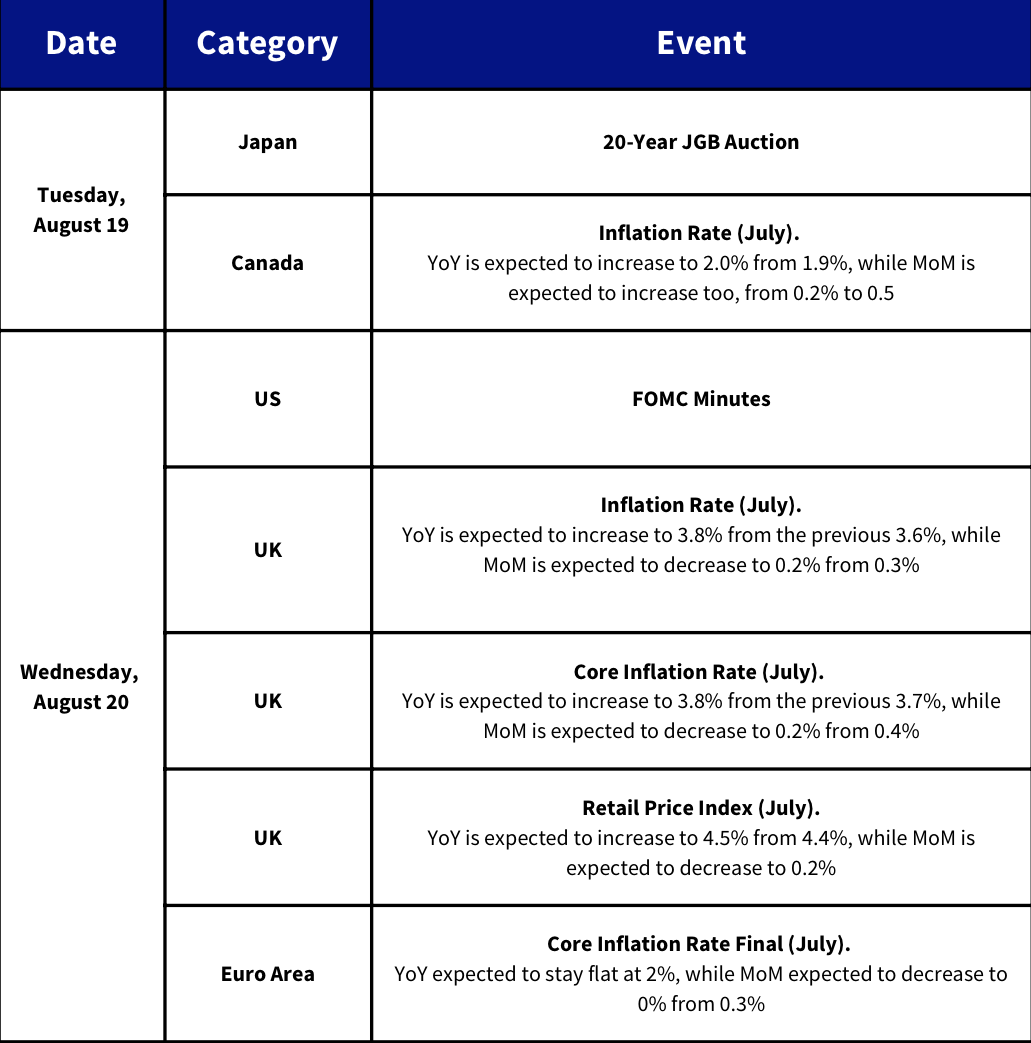
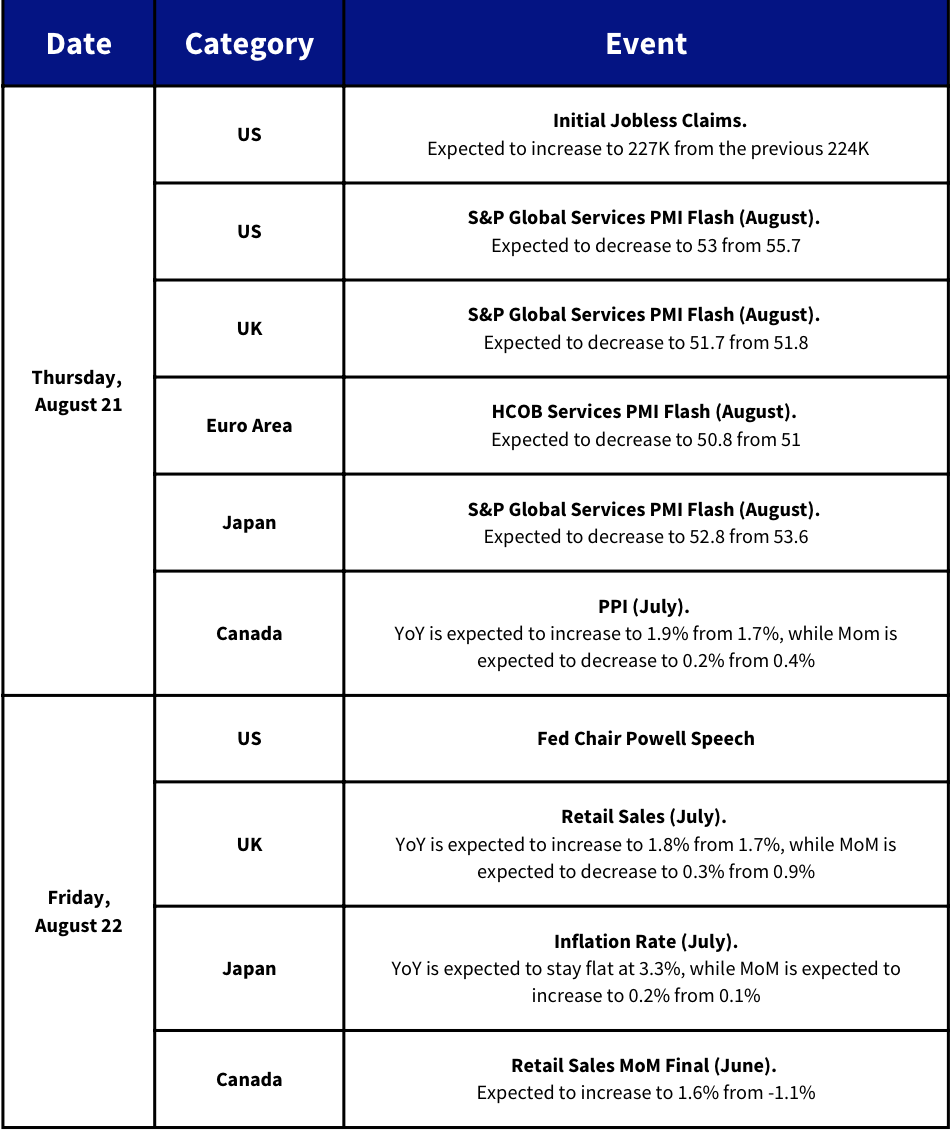
Crypto markets pulled back as Bitcoin fell 2.4% to $115K and Ether dropped 4.4% below $4,300, taking total market cap below $4T after BTC’s $125K all-time high. BTC and ETH ETFs saw net outflows of $14.1M and $59.3M, while ETH 7-day implied volatility reached 73%, above 180-day IV of 67%, and funding rates turned slightly negative. S&P DJI is exploring tokenized index funds beyond the S&P 500, enabling fractional ownership and easier cross-border trading. Norges Bank Investment Management boosted bitcoin-linked holdings 83% in Q2 to 11,400 BTC, mostly via MicroStrategy, while Metaplanet added 775 BTC to reach 18,888 BTC. Japan’s Financial Services Agency may approve a yen-backed stablecoin, JPYC, with up to ¥1 trillion issuance over three years. US equities retreated after stronger-than-expected PPI, while China’s Shanghai Composite hit a decade high despite slower production and retail growth.
Cryptocurrency prices across the board have pulled back, dragging the total market cap of crypto back below $4T only a few days after Bitcoin reached an all-time high on Aug 14.
Bitcoin is down 2.4% over the past 24 hours, trading at $115K while Ether has fallen by 4.4%, falling below the $4,300 mark.
The drop in BTC’s spot price began since it reached a new all-time high of $125K, but failed to hold that level for long as traders took profits at record-high levels. The selloff was then extended by a stronger than expected PPI report in the US, accelerating fears of tariff-induced inflation at the wholesale, or producer level, which forced markets to temporarily lower their expectations for a 25bps cut in September.
Risk-on assets including US equities all retreated following the release and, on Friday, the S&P 500 fell 0.3% to end its own blistering run that saw it trade near all-time highs last week too.
Both Bitcoin and Ether have been bolstered by voracious demand from Spot ETF buyers and digital-asset treasury companies over the past few months. However, Friday saw both BTC and ETH ETF products record net outflows. BTC ETF providers sold $14.1M worth of bitcoins, while the Ethereum products sold $59.3M — the first negative outflow since Aug 4, earlier in the month.
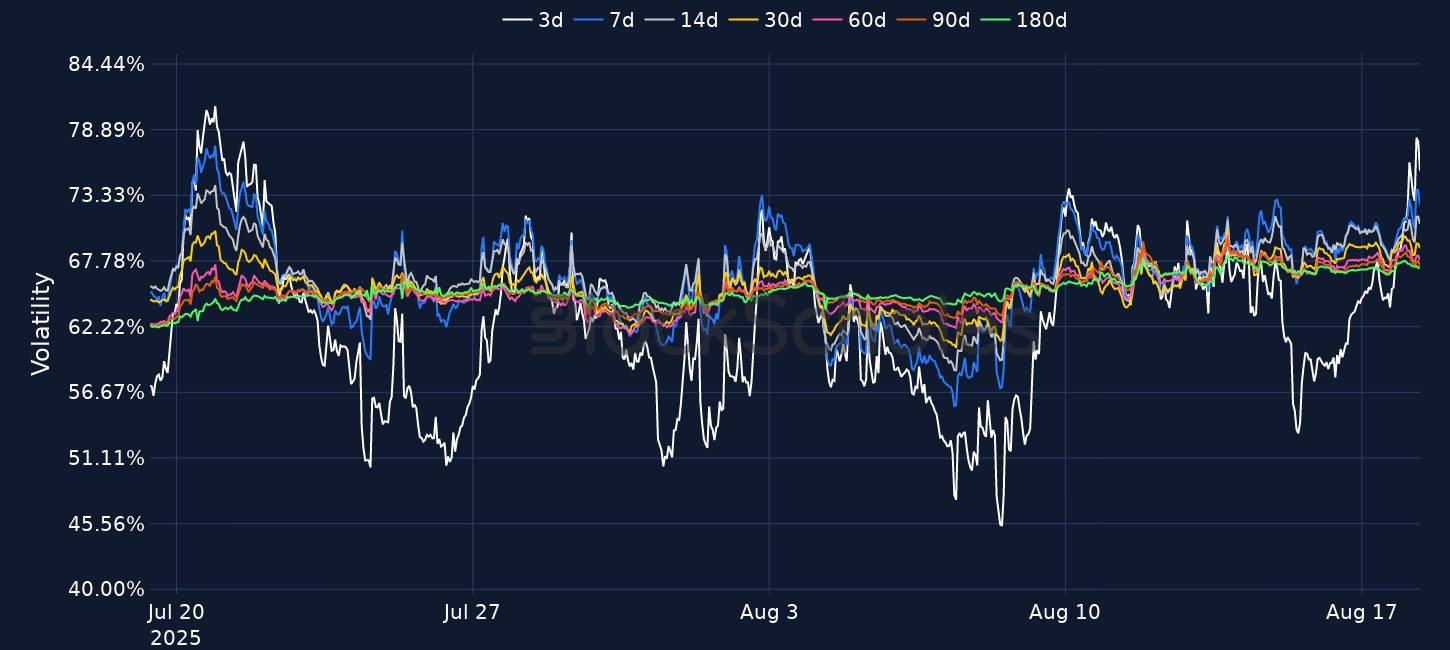
The sharp pullback in spot prices has taken its toll in derivatives markets. Funding rates for ETH which reached as high as 0.03% on an eight-hour basis last week when ETH came within $100 of its November 2021 all-time high have now retreated slightly into negative territory. That suggests short traders are paying a small premium to longs to maintain their short positions, a sign of bearish sentiment or expectations of a further drop in price.
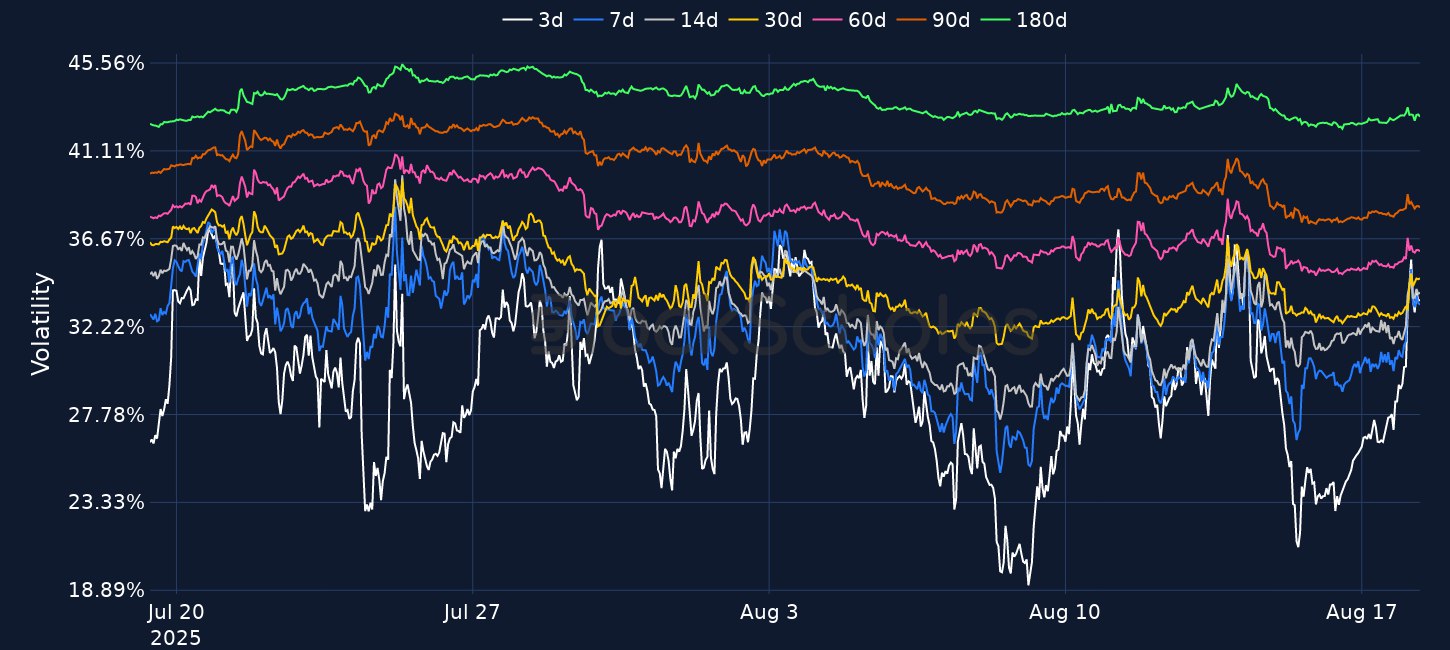
BTC funding rates have also dropped from a similar 0.03% level on Aug 14, when BTC reached its most recent all-time high, but unlike ETH funding rates, are not quite below 0% currently.
The pullback has also buoyed a slight increase in at-the-money implied volatility levels for BTC options. 7-day implied volatility has risen 3% over the past 24 hours, slightly flattening the term structure of volatility as the back end of the term structure has increased by a far smaller 0.2%.
Changes in at-the-money volatility levels have been more pronounced in ETH options, however. As we have commented on in the past, ETH traders have shown a much stronger willingness to push up the prices of ETH options and therefore their implied volatility levels. Indeed we see that over the weekend ETH's term structure of volatility has firmly inverted — 7-day ETH options currently trade with an IV of 73%, against 67% for 180-day options.
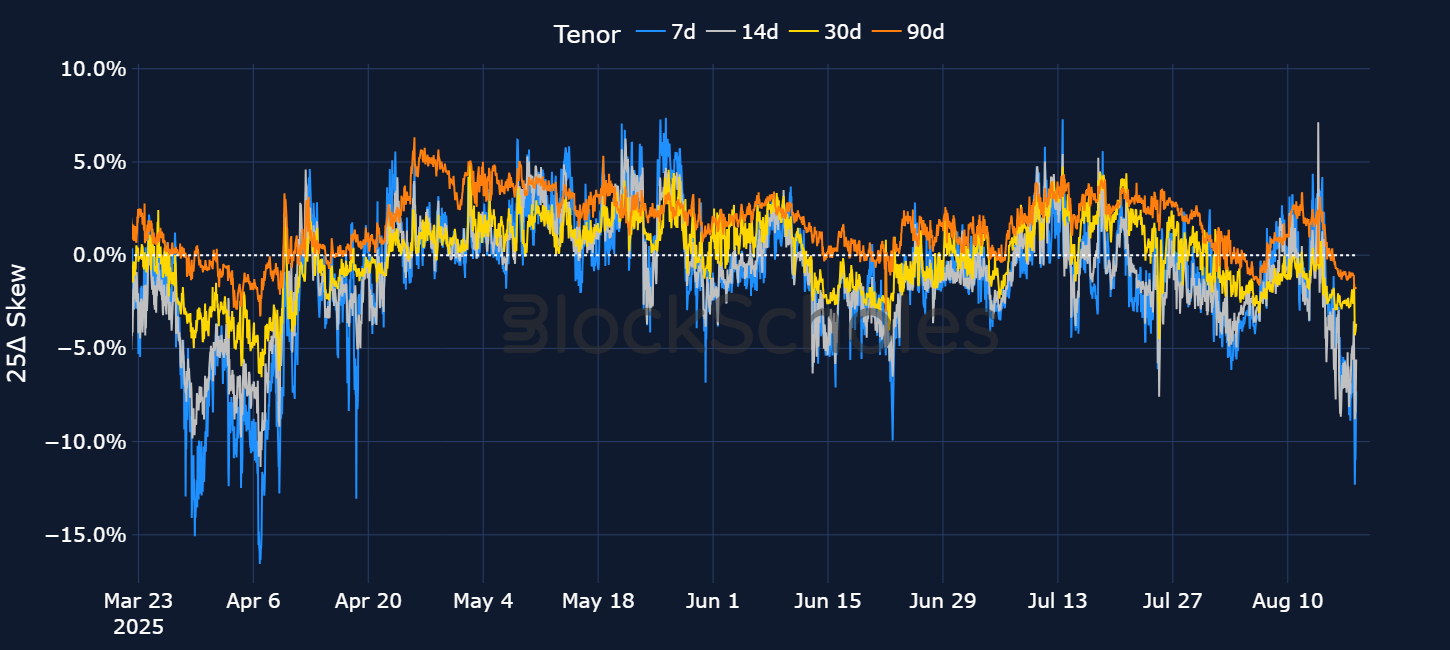
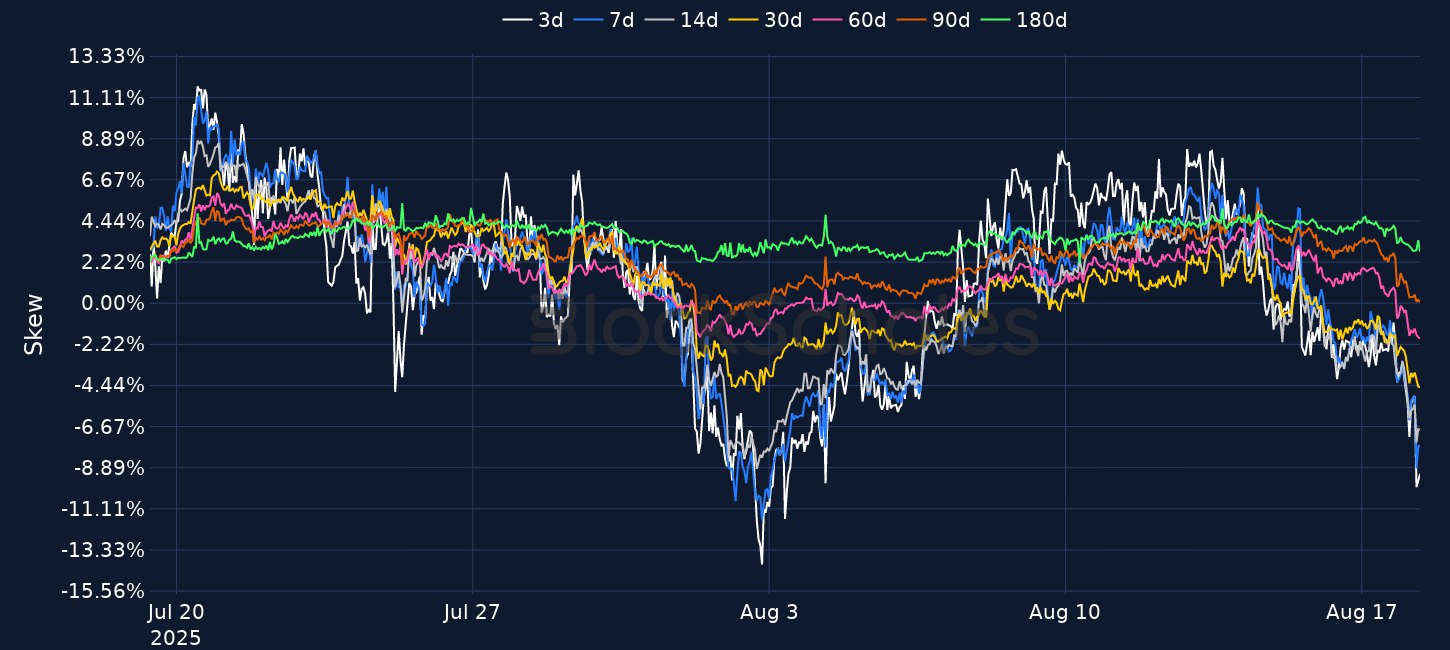
However, volatility smiles for both BTC and ETH show the bearish turn in sentiment most pronouncedly. While last week’s all-time high failed to materially push up demand for OTM calls, as 7-day volatility smiles assigned only a small 0.5% premium for call options over put options, volatility smiles for BTC across the term structure are now firmly skewed towards put options.
For 7-day BTC options, put-call skew fell as low as -12%, a level it last fell to on April 6, when BTC fell more than 9% to $75K on the back of comments from Commerce Secretary Howard Lutnick who dimmed all hopes of a reciprocal tariff delay in the week ahead.
Skew has since declined to -6% for 7-day BTC options, bringing it closer to the -7% ratio for 7-day ETH options.
On the macro front, President Trump claimed that his summit with President Putin last Friday was “extremely productive”, however fell short of achieving the ceasefire that Trump had been seeking before the meet.
In an interview with Fox News after the event, Trump said “There’s one or two pretty significant items but I think they can be reached … It’s really up to President Zelenskiy to get it done. And I would also say the European nations, they have to get involved a little bit, but it’s up to President Zelenskiy.”
Separately, stocks in China reached a decade high earlier today, bolstered by easing trade tensions between the US and China, following another extension of their tariff truce. The Shanghai Stock Exchange Composite Index closed at 3,728.03, a level it last saw back in 2015.
However, recent data from China suggests an across-the-board slowdown in its economy. Production at Chinese factories and mines rose at the slowest rate since November 2024, expanding by a less-than-expected 5.7% in July from a year earlier, compared with June’s gain of 6.8%. Additionally, retail sales in the region grew at their smallest pace since the start of 2025, increasing 3.7% YoY in July, down from 4.8% in June.
S&P Dow Jones (S&P DJI) is exploring tokenization of other benchmarks beyond the S&P 500, including the Dow Jones Industrial Average and thematic indexes. The firm views blockchain-based indexes as complementary to its existing business, structured as tokenized funds that track the underlying assets, enabling fractional ownership and easier cross-border trading.
S&P DJI sees tokenized indexes as complementary to its existing business as a bridge between traditional finance and DeFi, potentially making it easier for investors worldwide to buy, sell, and trade index funds, including in fractional amounts, by 2030.
Norges Bank Investment Management, the $1.7T sovereign wealth fund and the world’s largest by Total Assets, boosted its bitcoin-linked holdings by 83% in Q2, according to Standard Chartered’s Geoffrey Kendrick.
Exposure increased from 6,200 to 11,400 BTC, almost entirely via the purchase of MicroStrategy shares, with a small addition to Japan’s “MicroStrategy,” Metaplanet.
Metaplanet acquired 775 more Bitcoin for around $120k per BTC, bringing their total holdings to 18,888 BTC, currently worth over $2B.
According to Nikkei Asia, Japan’s Financial Services Agency is expected to approve the launch of the country’s first yen-backed stablecoin, JPYC, as soon as this autumn.
As a stablecoin, major use cases include cross-border money transfers and corporate transactions. Once approved, JPYC plans to issue up to 1 trillion yen worth of JPYC over the next three years.
The stablecoin will be pegged 1-1 with the Japanese yen, backed by liquid reserves including bank deposits and Japanese government bonds.
Cryptocurrency prices across the board have pulled back, dragging the total market cap of crypto back below $4T only a few days after Bitcoin reached an all-time high on Aug 14.
Bitcoin is down 2.4% over the past 24 hours, trading at $115K while Ether has fallen by 4.4%, falling below the $4,300 mark.
The drop in BTC’s spot price began since it reached a new all-time high of $125K, but failed to hold that level for long as traders took profits at record-high levels. The selloff was then extended by a stronger than expected PPI report in the US, accelerating fears of tariff-induced inflation at the wholesale, or producer level, which forced markets to temporarily lower their expectations for a 25bps cut in September.
Risk-on assets including US equities all retreated following the release and, on Friday, the S&P 500 fell 0.3% to end its own blistering run that saw it trade near all-time highs last week too.
Both Bitcoin and Ether have been bolstered by voracious demand from Spot ETF buyers and digital-asset treasury companies over the past few months. However, Friday saw both BTC and ETH ETF products record net outflows. BTC ETF providers sold $14.1M worth of bitcoins, while the Ethereum products sold $59.3M — the first negative outflow since Aug 4, earlier in the month.
The sharp pullback in spot prices has taken its toll in derivatives markets. Funding rates for ETH which reached as high as 0.03% on an eight-hour basis last week when ETH came within $100 of its November 2021 all-time high have now retreated slightly into negative territory. That suggests short traders are paying a small premium to longs to maintain their short positions, a sign of bearish sentiment or expectations of a further drop in price.
BTC funding rates have also dropped from a similar 0.03% level on Aug 14, when BTC reached its most recent all-time high, but unlike ETH funding rates, are not quite below 0% currently.
Don't miss what's next
Upgrade your Block Scholes account to unlock this article and other exclusive insights
Premium
$30/mo
Access previous and future reports, market insights & deep dives.
Bitcoin has rebounded from a sideways range around $89K to $92K, while Ether has moved from $3K to just under $3.2K, despite weekly outflows of $87.7M from spot BTC ETFs and $65.4M from spot ETH ETFs. Implied volatility term structures are modestly inverted, with 7D BTC IV at 50% versus 47% for 180D, and 7D ETH IV at 73% versus 70% for longer tenors, while 30D skew sits at -6% for BTC and -4% for ETH, indicating a smaller downside premium for Ether. In traditional markets, the S&P 500 is up over 17% year to date and sits just below its October all-time high, while BTC is now -2% year to date after the October liquidation. Into Wednesday’s final FOMC meeting of the year, markets are pricing an 87% probability of a 25bp cut, with core PCE at 0.2% MoM and 2.8% YoY, and University of Michigan consumer sentiment ticking up to 53.3 in December from 51 in November.
BTC stalled after an intraday spike to $94k and now trades just above $91k, with ETH slipping from $3,200 to $3,100 as short-dated OTM put premia compressed from 11 to 5 vols over calls in BTC and to ~2.5 vols in ETH, even as ETH is only +4% over five days despite BitMine nearing 5% of supply and the Fusaka upgrade going live. Spot flows remain a headwind: spot ETH ETFs have taken in just $9.8m net so far this week, while spot BTC ETFs have seen $142.5m of outflows including a $194.6m single-day bleed, the largest since 20 November. Structurally, 21Shares secured approval to list the first US Sui-linked leveraged product, the 2x SUI ETF (TXXS), taking the crypto ETF tally to 74 for 2025 and 128 overall, while Base launched a Chainlink-CCIP bridge to Solana to move SOL/SPL and Base-native assets cross-chain.