Back to Research
Last Updated:  
December 24, 2025
9 min read

“TRUMP, and some other Geniuses, got it right.”

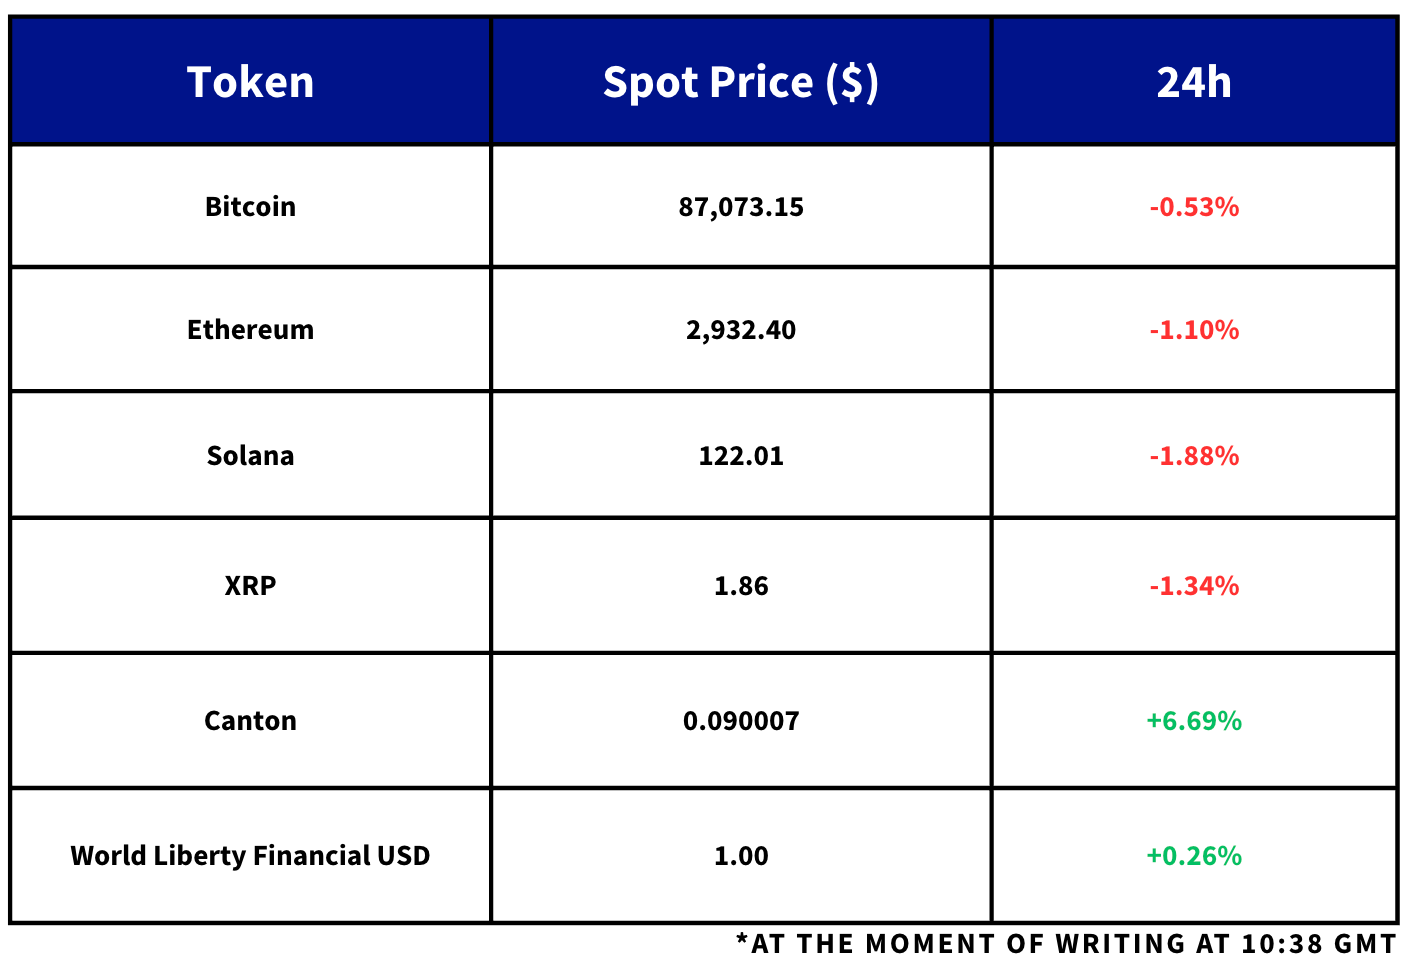
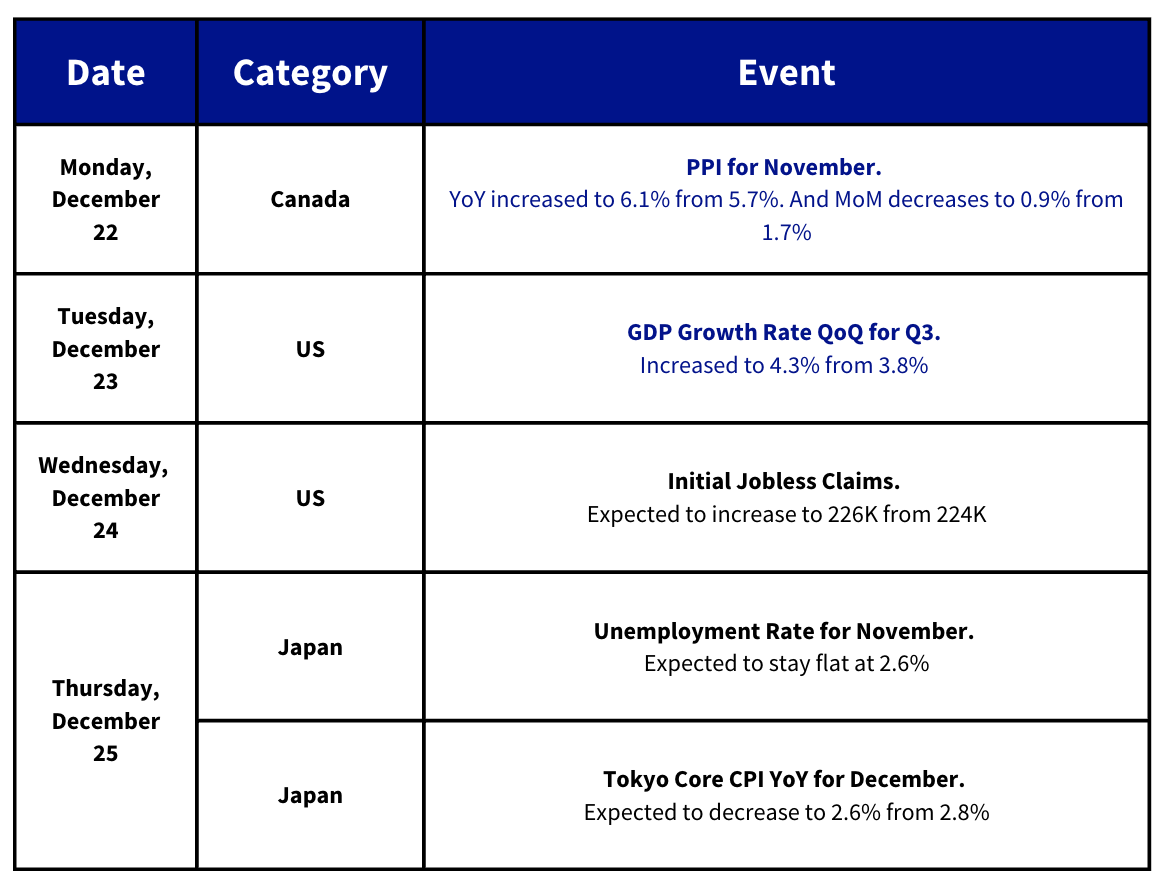
US equities kept grinding higher after Q3 GDP printed 4.3% annualised vs 3.2% consensus, pushing the S&P 500 +0.46% to a new record (Dow +0.2%, Nasdaq +0.6%) despite consumer confidence falling 3.8 points to 89.1. BTC rejected $90k again and traded ~$86,000 while ETH failed at $3,000 and traded ~$2,900, alongside spot ETF outflows (BTC -$188.6M; ETH -$95.5M) and -$497.1M net BTC ETF flows last week (vs +$286.6M the prior week). In relative terms, SOL and XRP spot ETFs saw inflows on 23 Dec (+$4.2M and +$8.19M). Gold hit a new ATH above $4,500/oz, with YTD gains of +71% for gold and ~+150% for silver.

Find out our latest reports, listed below:


Market Snapshot: Overnight Moves

Daily Updates:

  • The Santa Rally in US equities and safe-haven assets such as gold continued yesterday while BTC, on the other hand, failed to break the $90K wall of resistance. That makes the current macro drop unique: traditional haven and traditional risk assets are rallying concurrently, while BTC, for now, appears to be lagging behind. 
  • It currently trades at $86,000, while its counterpart ETH also failed to break past its own resistance level of $3,000 and now trades at $2,900. The failure of both assets to break past their respective psychological levels coincides with another day of outflows from Spot ETF products. BTC Spot ETFs saw their fourth day of outflows (-$188.6M), while ETH Spot ETFs sold $95.5M worth of the token. 
  • On a weekly basis, US spot Bitcoin ETFs recorded $497.1M in net outflows last week, reversing the $286.6M in net inflows posted in the week ended 12 December.
  • In contrast, SOL and XRP spot ETFs recorded net inflows on 23 December.
  • SOL spot ETFs added $4.2M, while XRP spot ETFs took in $8.19M in net new capital.
  • On Wall Street, traders and investors were bolstered by macroeconomic data from the US showcasing bumper growth in the economy. 
  • According to the BEA’s delayed report, inflation-adjusted GDP, a measure of the value of goods and services produced in the US, grew at an annualised pace of 4.3% between July and September 2025 (Q3). That was well above the median Bloomberg forecast of 3.2%, and the fastest pace since Q3 2023. 
  • It helped advance the S&P 500 for a fourth consecutive day, with the index closing +0.46% to a new record high, while the Dow rose 0.2% and the Composite Nasdaq index gained 0.6%.
  • The BEA’s GDP report was originally slated for Oct 30, however it was delayed by the federal government shutdown. Consumer spending, which accounts for ⅔’s of the US economy, advanced at a 3.5% annualised pace, driven by strong spending on services, healthcare and travel. That was a significant jump from the April to June growth of 2.5%. Additionally, business investment grew at a 2.8% rate, driven by outlays on computer equipment, while investment in data centers climbed to a fresh record — furthering the case for a supportive backdrop to the AI narrative. 
  • Interestingly, despite the Q3 GDP data showing a resilient consumer, the Conference Board’s consumer confidence index, released yesterday, showed a 3.8 point drop to 89.1 in December, the fifth straight monthly decline. 
  • The survey also showed that 26.7% of consumers said jobs were “plentiful,” down from 28.2% in November, while 20.8% of consumers said jobs were “hard to get,” up from 20.1% last month.
  • On Truth Social, President Trump jokingly said “Q3 GDP came in at 4.3%, BLOWING PAST expectations of 3.2%. 60 of 61 Bloomberg Economists got it WRONG, but TRUMP, and some other Geniuses, got it right.”
  • He also separately said in another post that “I want my new Fed Chairman to lower Interest Rates if the Market is doing well, not destroy the Market for no reason whatsoever … Anybody that disagrees with me will never be the Fed Chairman!”
  • Gold prices rose to an all-time high, exceeding $4,500 an ounce. We covered in yesterday’s comment that escalating geopolitical tensions between the US and Venezuela, as well as expectations for rate cuts in 2026, are partly responsible for that advance. Yesterday marked the third consecutive day of gains for gold, and also saw other precious metals including silver and platinum reach new records. 
  • Year-to-date, gold is up 71%, while silver has risen upwards of 150%, bringing both of the metals on track for their best yearly return since 1979.
  • The SEC has filed charges against three purported crypto trading platforms and four investment clubs, alleging they orchestrated an online “investment confidence” scam that defrauded retail investors of more than $14M.
  • In a complaint lodged in the US District Court for the District of Colorado, the regulator says the scheme operated from January 2024 to January 2025, using social media adverts to funnel victims into WhatsApp-based “investment clubs.”
  • There, individuals posing as financial professionals allegedly used group chats to build credibility and solicit funds. 

This Week’s Calendar:

Charts of the Day:

Figure 1. Block Scholes BTC Risk-Appetite Index (white, left-hand axis) and BTC spot price (orange, right-hand axis)
Figure 2. Block Scholes ETH Risk-Appetite Index (white, left-hand axis) and ETH spot price (purple, right-hand axis)
Figure 3. BTC at-the-money implied volatility across selected tenors. Source: Deribit, Block Scholes
Figure 4. ETH at-the-money implied volatility across selected tenors. Source: Deribit, Block Scholes
Figure 5. BTC 25-delta put-call skew ratio across selected tenors. Source: Deribit, Block Scholes
Figure 6. ETH 25-delta put-call skew ratio across selected tenors. Source: Deribit, Block Scholes

Share this post
Copy URL
www.blockscholes.com/premium-research/trump-and-some-other-geniuses-got-it-right

Find out our latest reports, listed below:

Daily Updates:

  • The Santa Rally in US equities and safe-haven assets such as gold continued yesterday while BTC, on the other hand, failed to break the $90K wall of resistance. That makes the current macro drop unique: traditional haven and traditional risk assets are rallying concurrently, while BTC, for now, appears to be lagging behind. 
  • It currently trades at $86,000, while its counterpart ETH also failed to break past its own resistance level of $3,000 and now trades at $2,900. The failure of both assets to break past their respective psychological levels coincides with another day of outflows from Spot ETF products. BTC Spot ETFs saw their fourth day of outflows (-$188.6M), while ETH Spot ETFs sold $95.5M worth of the token. 
  • On a weekly basis, US spot Bitcoin ETFs recorded $497.1M in net outflows last week, reversing the $286.6M in net inflows posted in the week ended 12 December.
  • In contrast, SOL and XRP spot ETFs recorded net inflows on 23 December.
  • SOL spot ETFs added $4.2M, while XRP spot ETFs took in $8.19M in net new capital.

Market Snapshot: Overnight Moves