Tazmina Rashid
Research Analyst
This week's edition of our Crypto Altcoins Analytics.

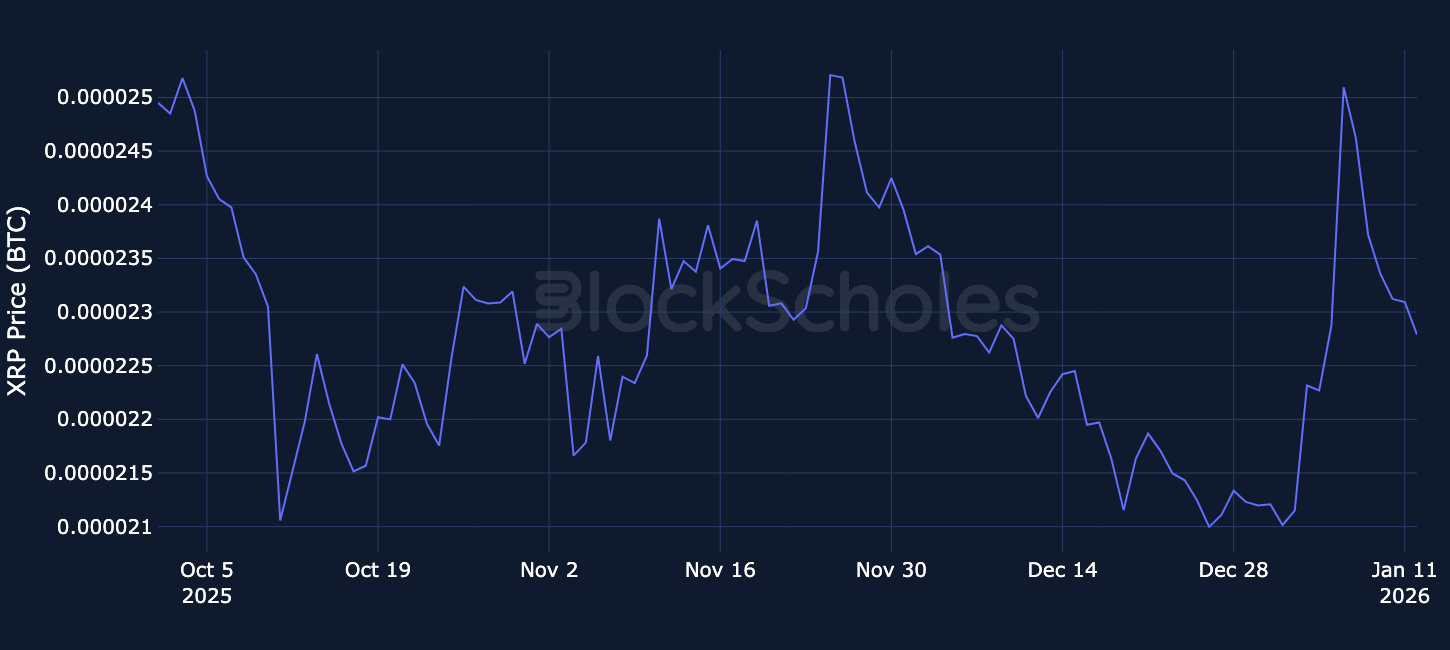
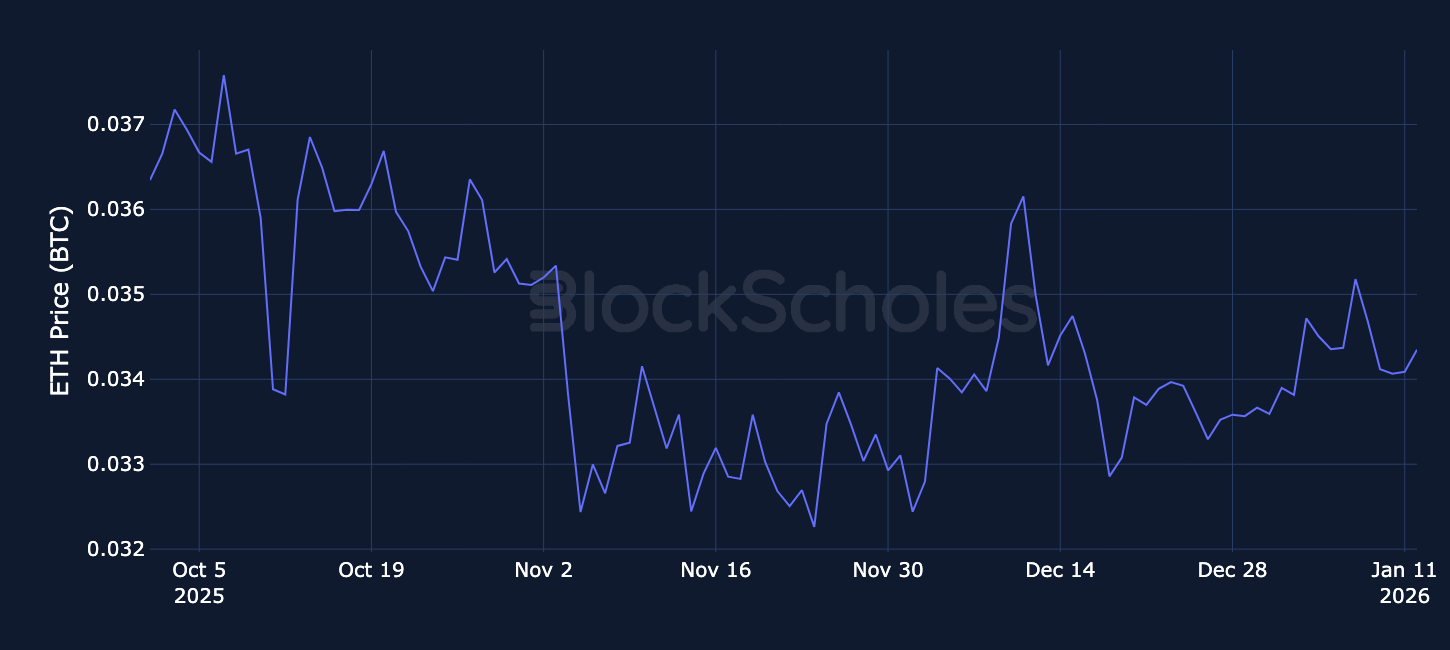
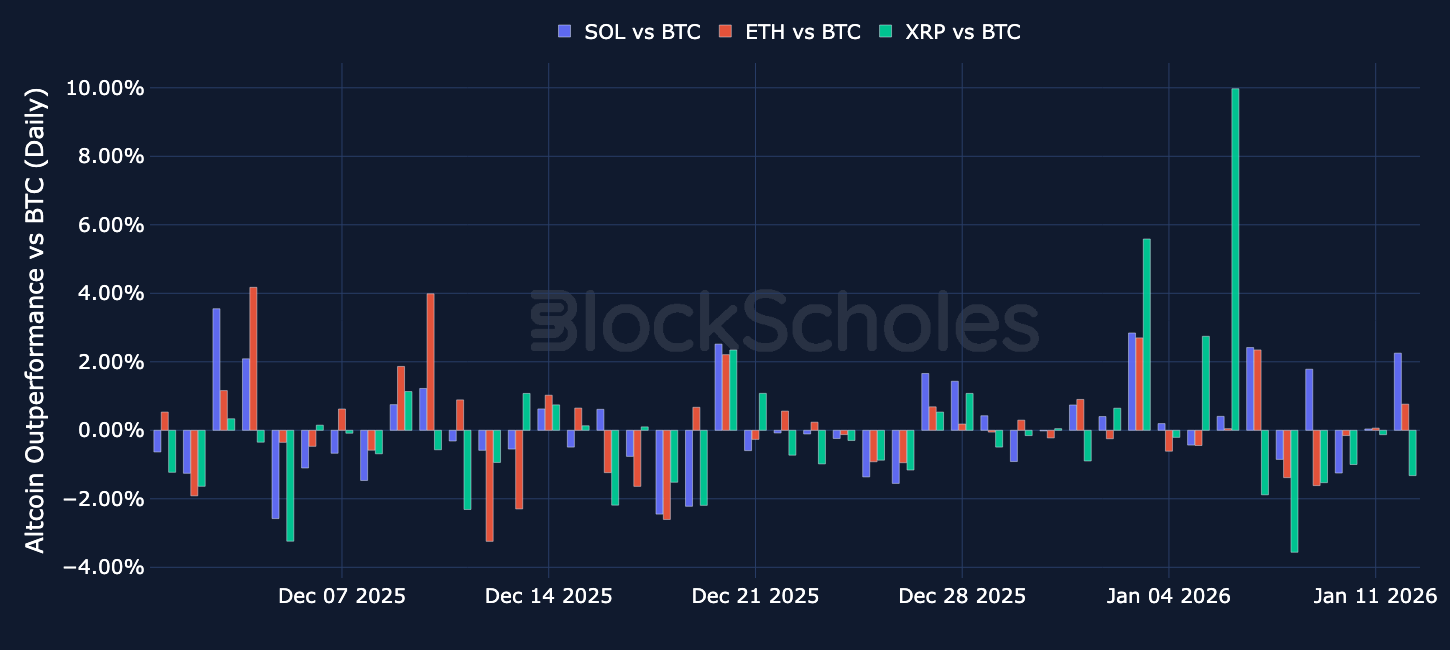
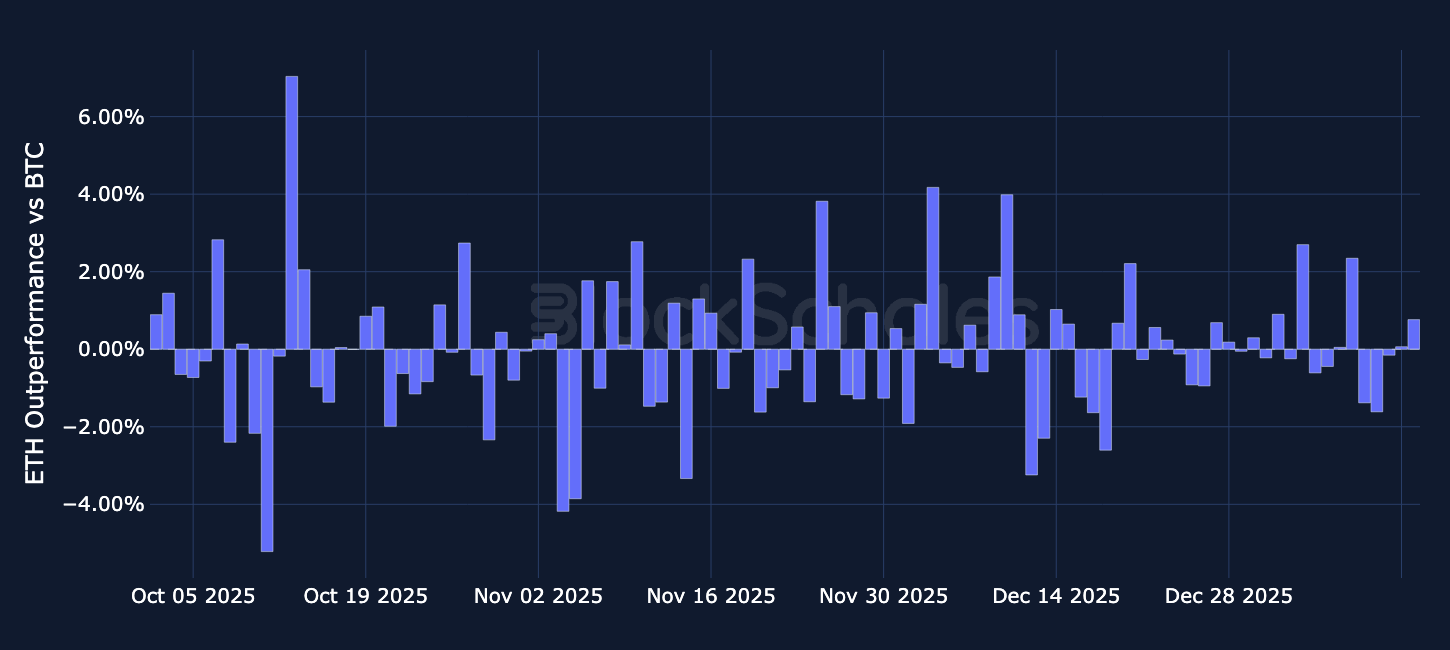
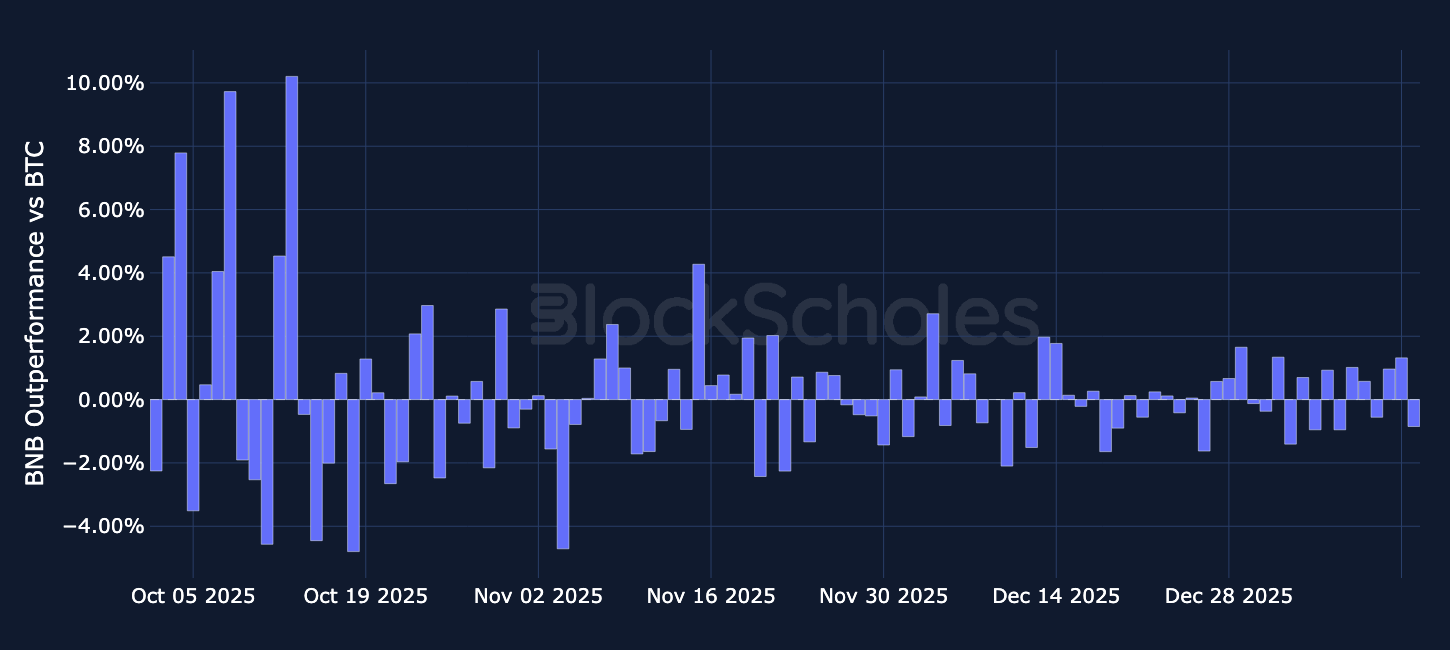
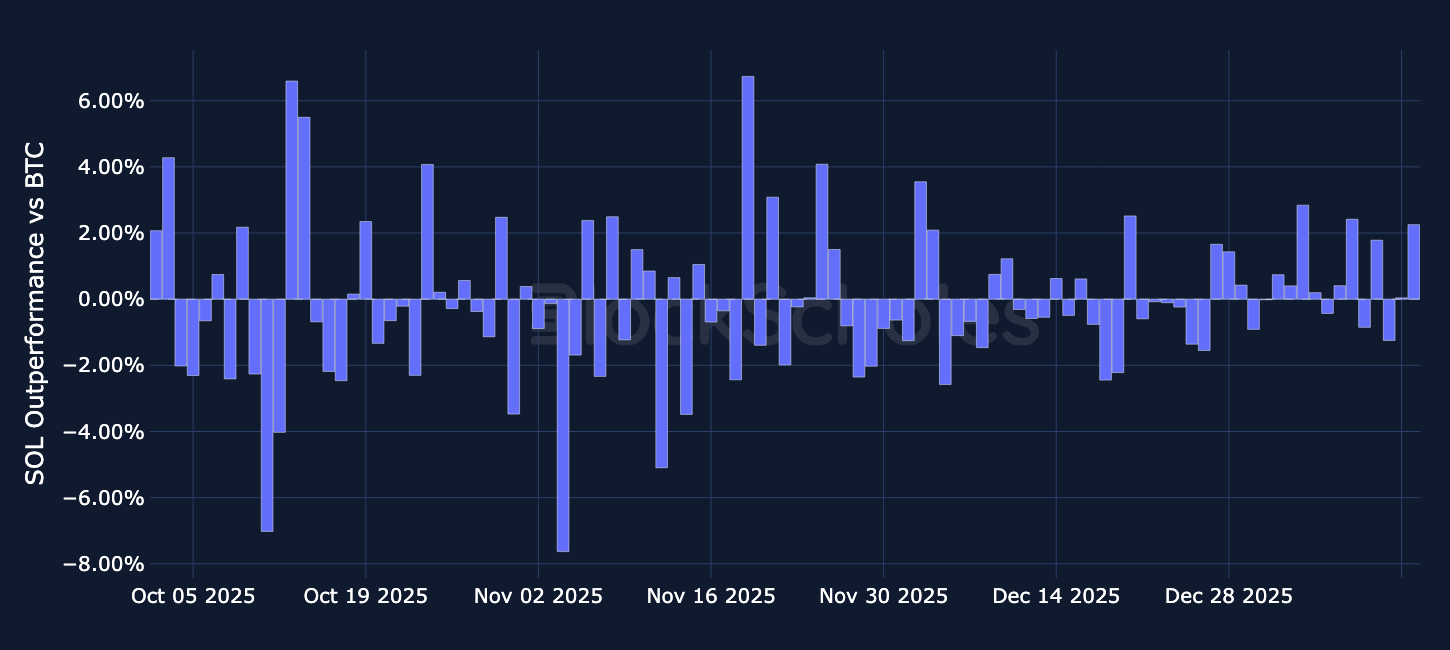
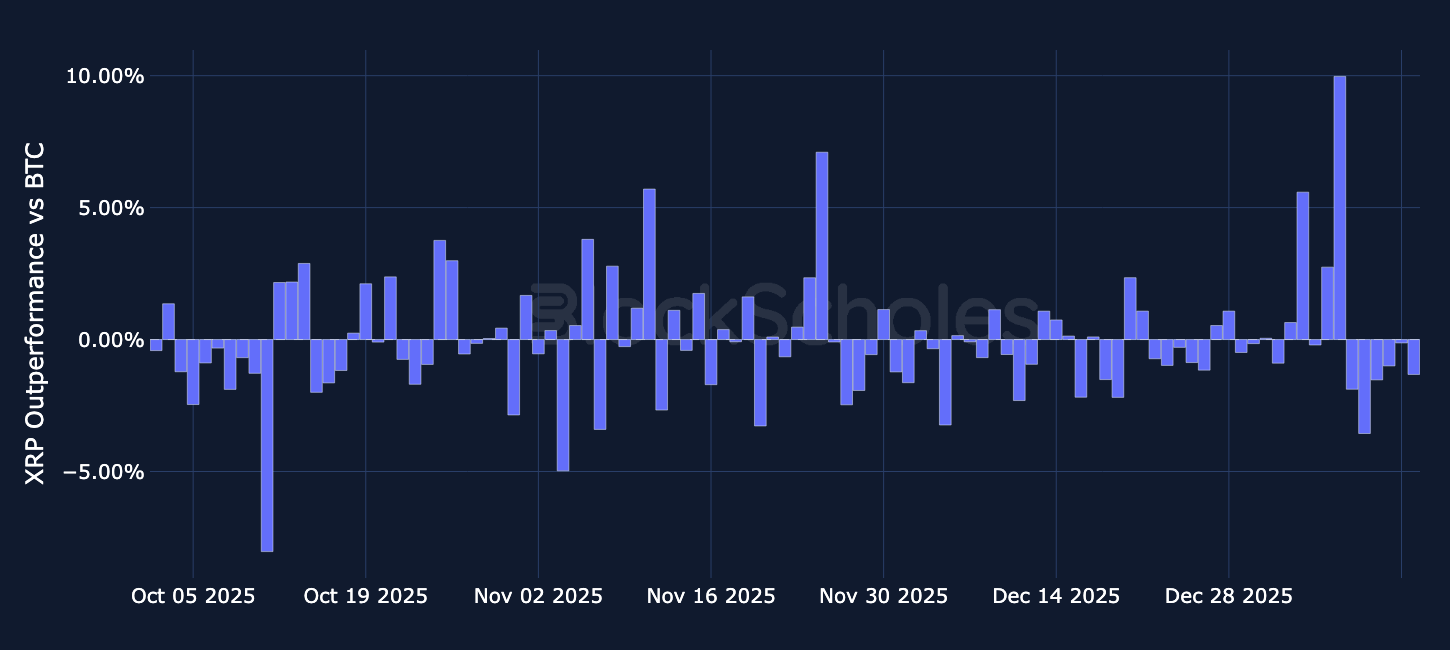
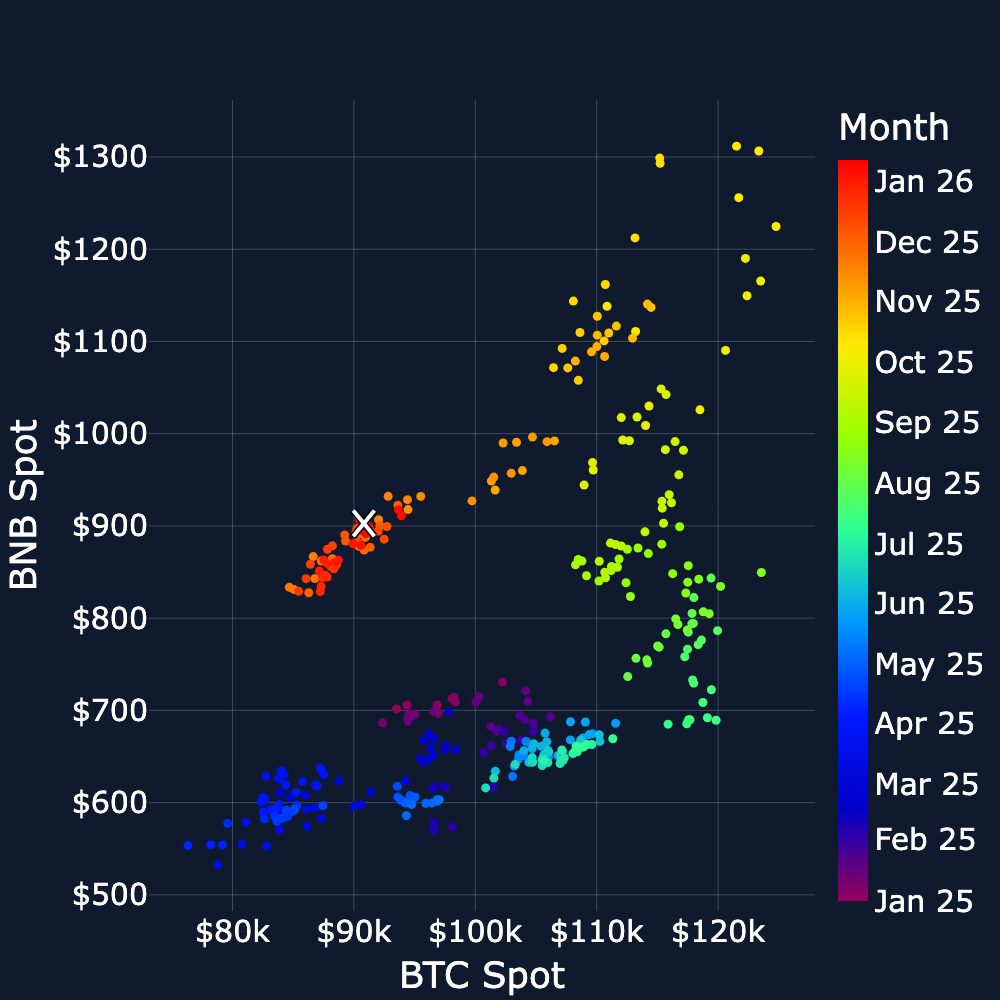
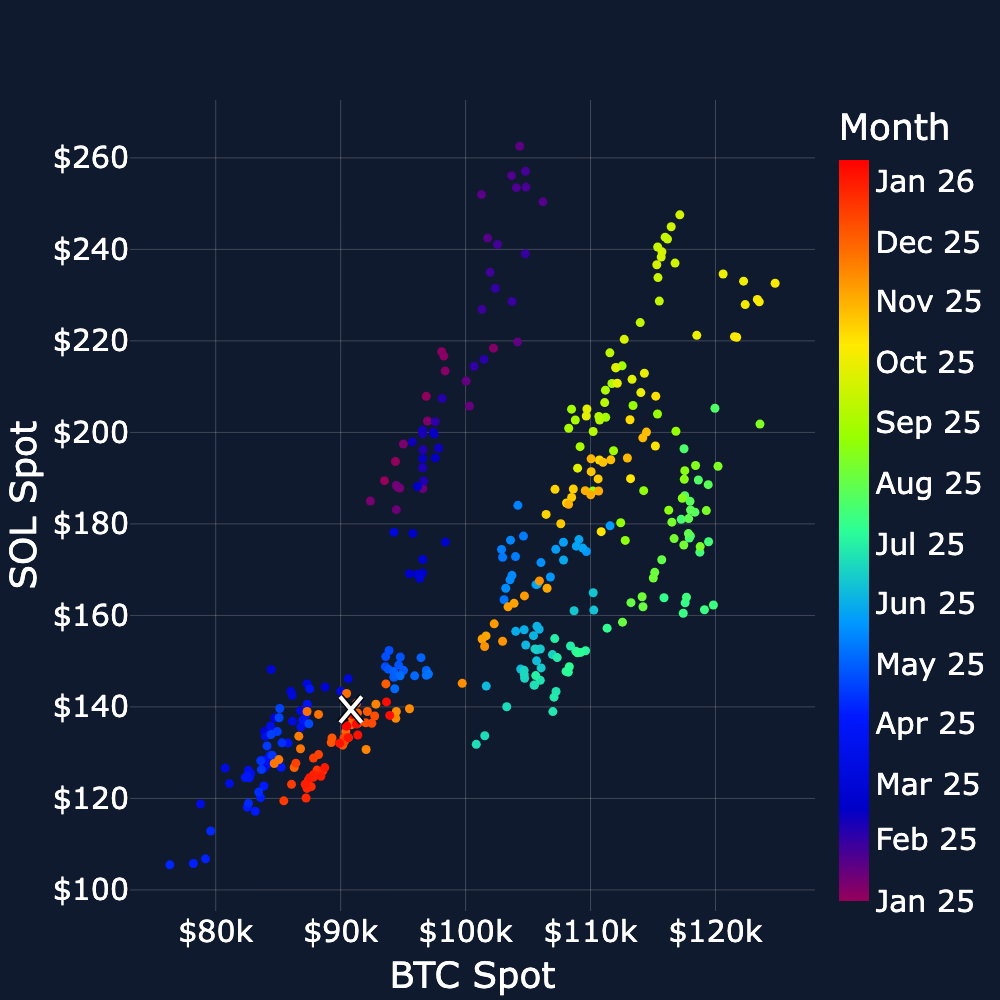
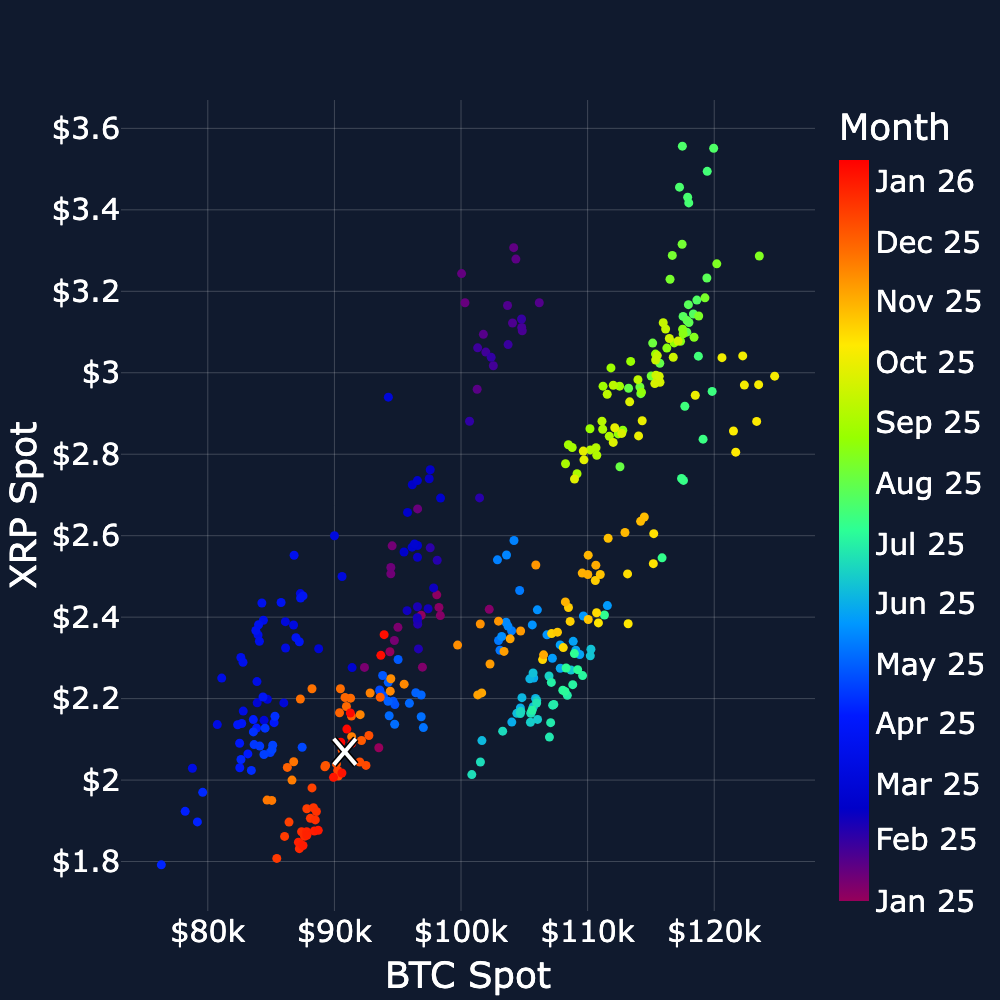
Altcoins Outperformance – Over the past week, SOL and ETH have largely moved in line with BTC, with most daily relative returns staying close to zero and only a few modest positive days. XRP has been the frontrunner, showing larger and more frequent spikes versus BTC, including a standout near +10% in early January, then pulled back to negative to almost -4%.
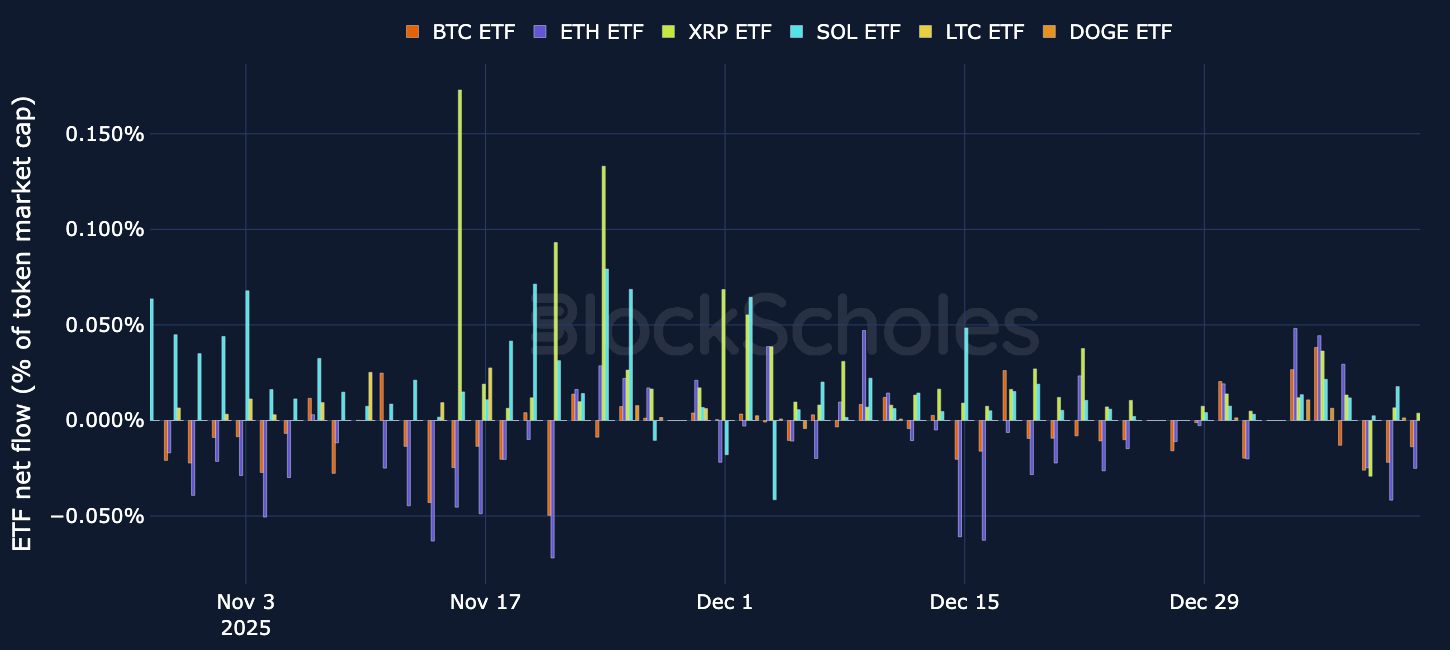
ETF Flows – Since 2 Jan, ETF flows have been relatively small. Most of the activity has been in BTC and ETH, with ETH showing the bigger moves when flows turned negative. Altcoin ETF flows were still small overall, with only occasional small inflow days in SOL and XRP on a market-cap-normalised basis.
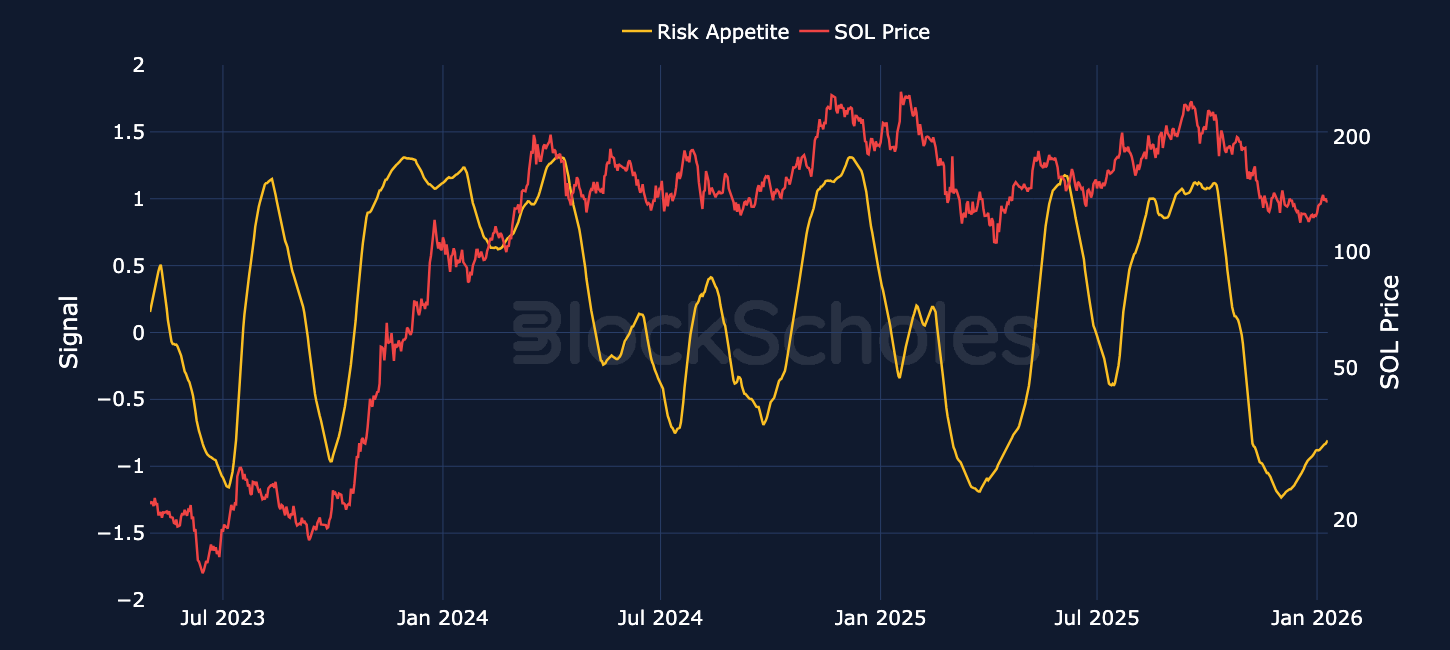
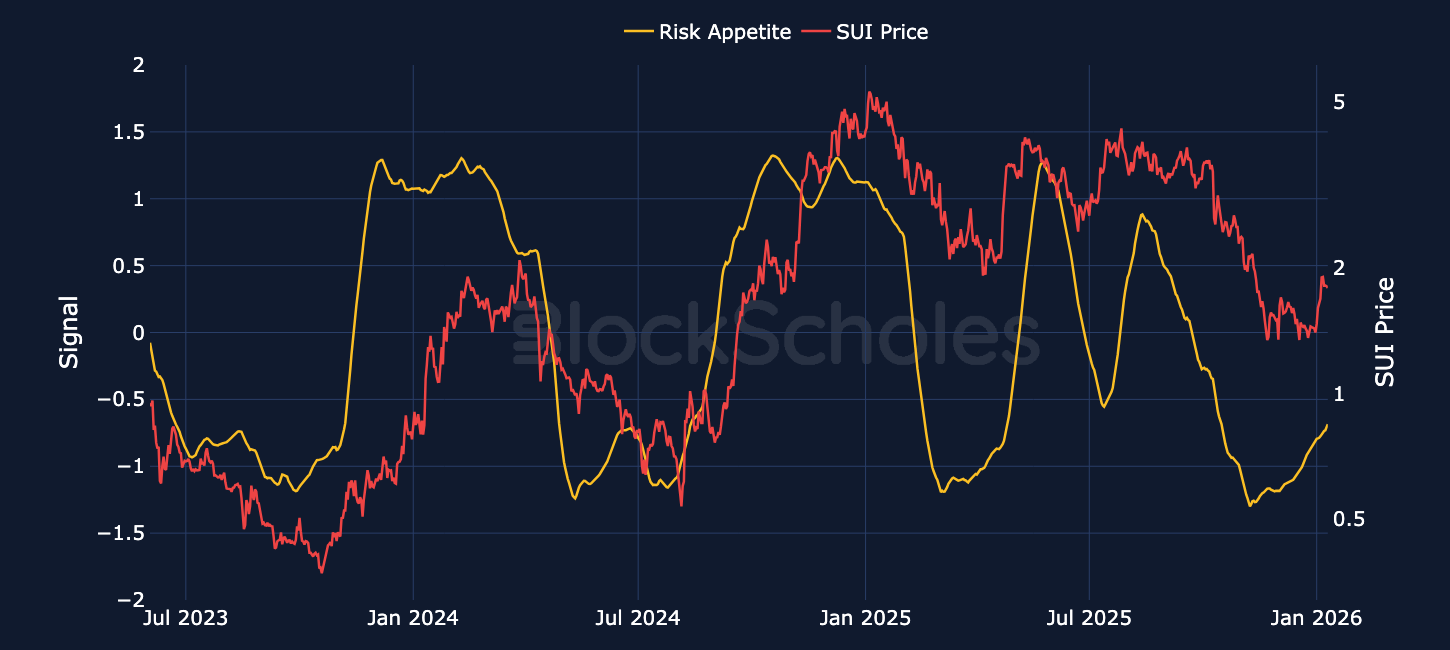
Block Scholes’ Risk Appetite Index measures the level of euphoria (above 1) or panic (below -1) in the spot market. Momentum in this index shows a strong relationship to spot returns.